The vulnerabilities top-15 club — and what their products have in common
Six thousand eight hundred and ninety-three vendors have a CVE published in the last 24 months. Fifteen of them own 48% of every Known Exploited Vulnerability (“KEV”) over the last year. Once you look at the list, the products inside it fall into three tidy clusters — and one entrant that doesn’t fit any of them.
The fifteen
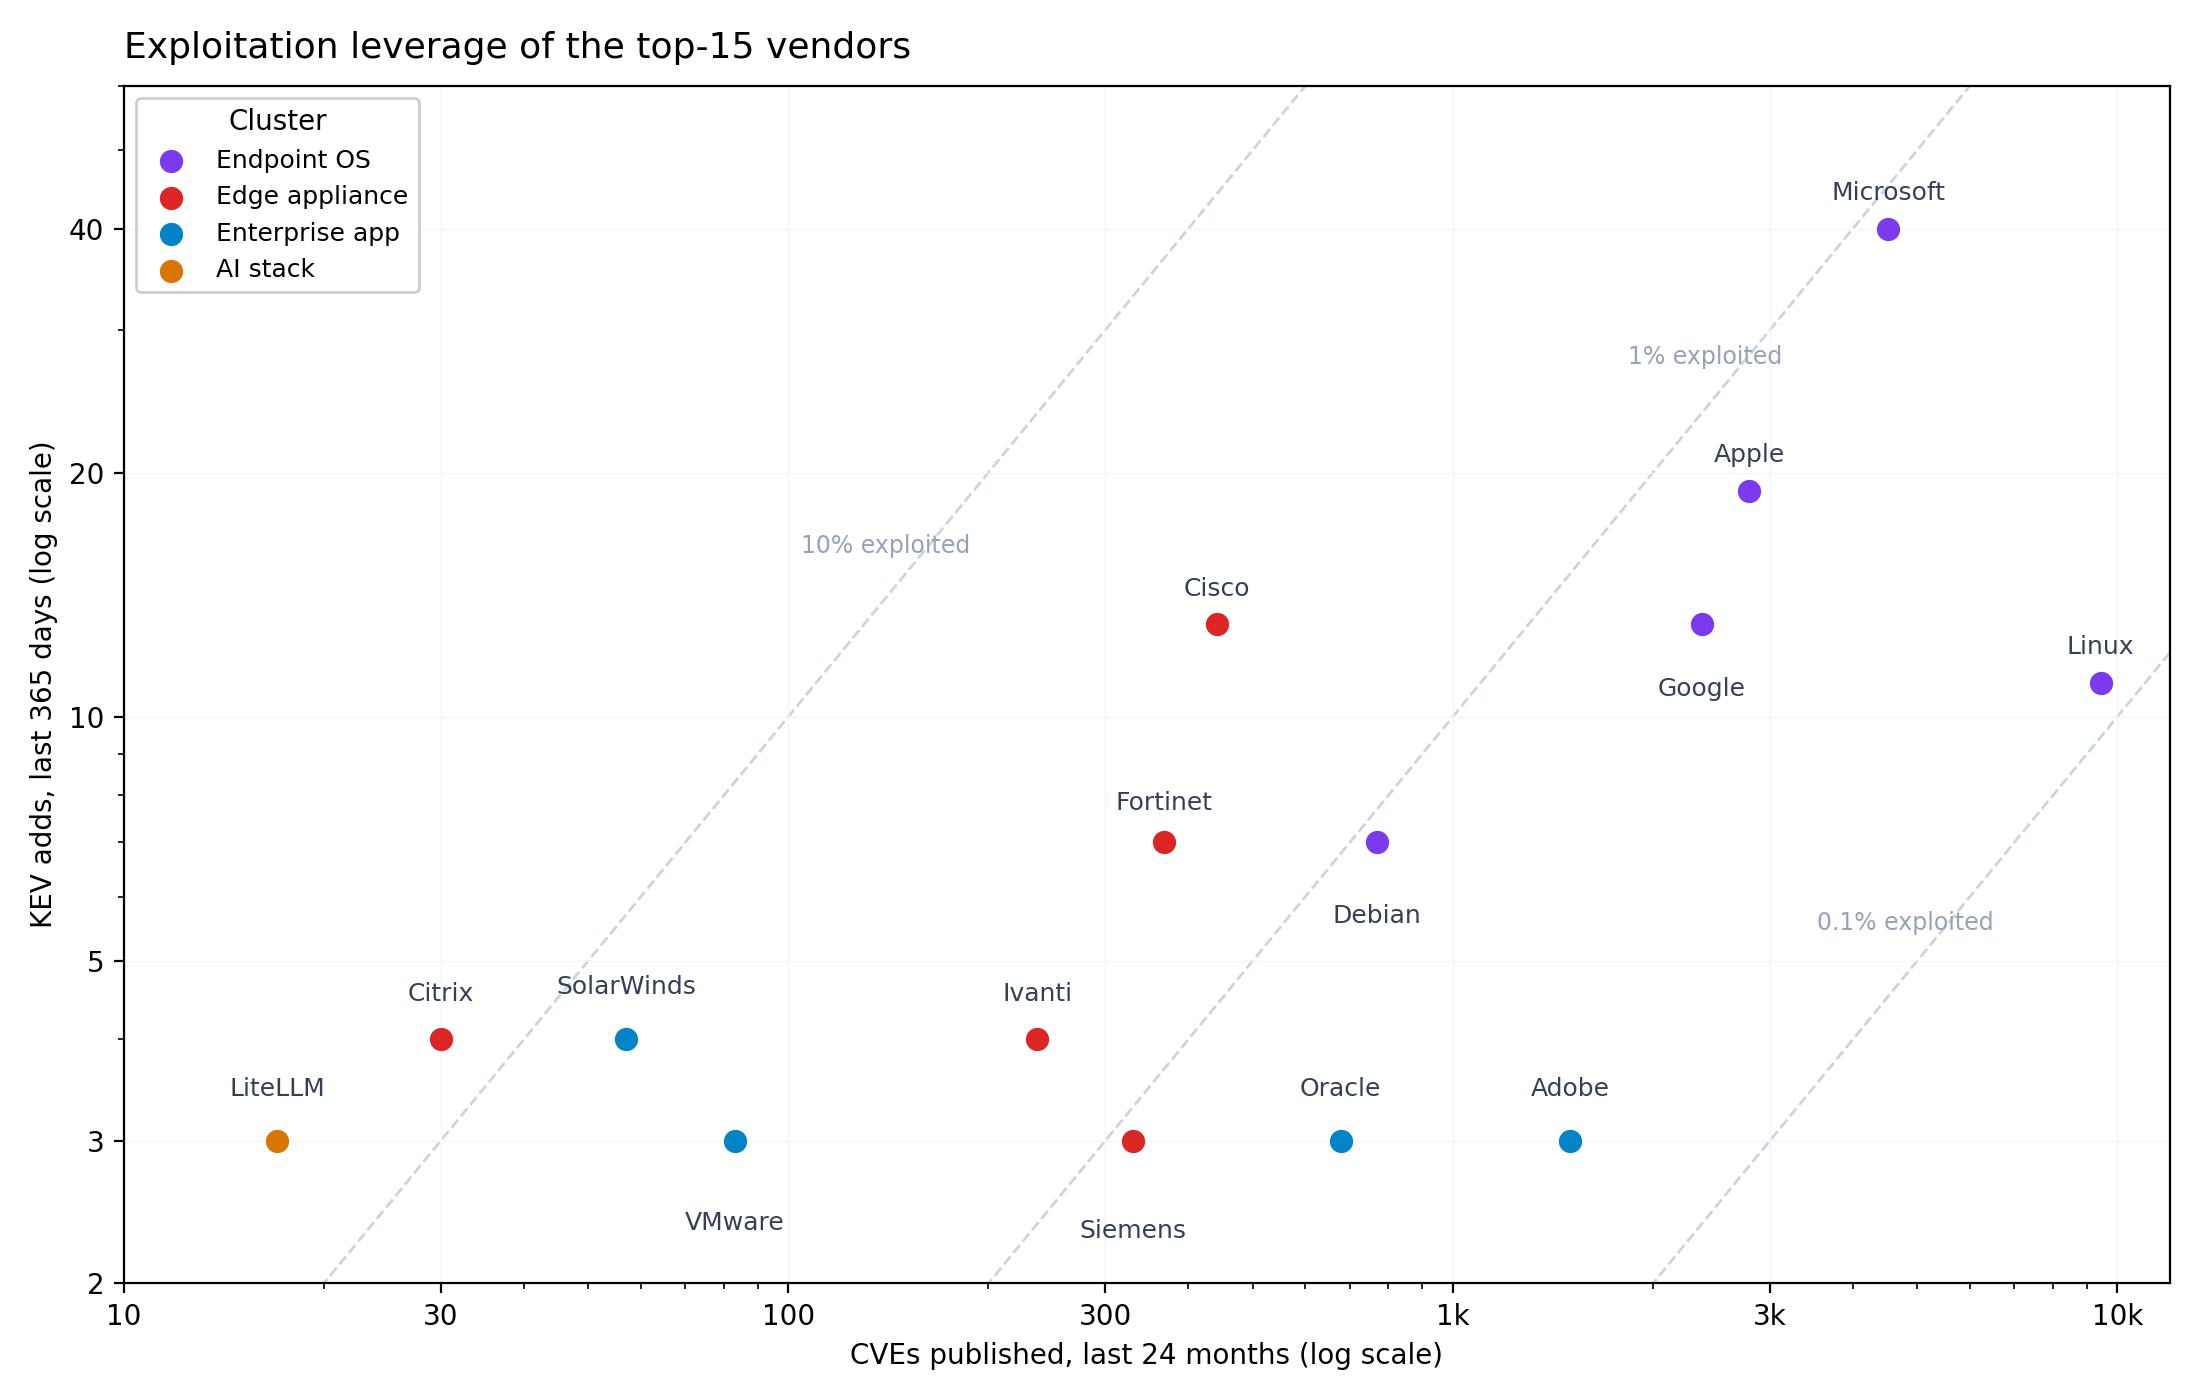
Here are the fifteen vendors, plotted by how many CVEs they published in the last 24 months against how many of those landed on KEV in the last year. The distance from the diagonals is the whole story: a handful of vendors turn a small catalogue into outsized exploitation, while the high-volume names sit far below the 1%-exploited line. The full ranking is in the table further down.
Endpoint OS (memory-safety bugs)
Six of the fifteen are general-purpose operating systems and
their two big browsers: Microsoft Windows, Apple
macOS / iOS, Google Chrome / Android, Linux kernel, and
Debian. The signature weakness here is
CWE-416 — use-after-free — for five of
the six. Linux is the outlier with CWE-476
null-pointer-dereference on top, but use-after-free is its
number-two weakness. These are products with a billion+
attack surface, written in C/C++, where a single freed
pointer becomes a code-execution primitive.
What unites this cluster operationally is that the bugs reach attackers via endpoint compromise: a malicious page, a malicious document, or a malicious neighbour process. The defender’s job is patching cadence and exploit-mitigation (ASLR / CFG / shadow stack) hardening, not network segmentation.
Edge appliances (injection + authz bypass)
Five of the fifteen are appliances that sit on the internet-facing edge: Cisco ASA / IOS XE, Fortinet FortiOS, Citrix NetScaler, Ivanti Connect Secure, and Siemens telecontrol gear. The signature weaknesses are different from the endpoint-OS cluster: OS command injection (CWE-78), path traversal (CWE-22), SQL injection (CWE-89), and privilege-management bugs (CWE-269).
These bugs live in management interfaces written in PHP, Perl,
or homemade C wrappers around shell, where authenticated or
unauthenticated input crosses a trust boundary into
exec, the filesystem, or the database. Once
compromised, the appliance becomes a perimeter pivot: VPN
sessions, IPsec tunnels, or the management LAN itself. That
leverage is why ransomware crews keep picking them.
Enterprise / management apps (XSS + authz)
Four of the fifteen are enterprise applications and middleware: SolarWinds, Oracle, Adobe, and VMware. The signature weaknesses are cross-site scripting (CWE-79), broken access control (CWE-284), and path traversal (CWE-22) — classic web-app bug classes, exploited the way enterprise webapps have been exploited for fifteen years. The difference in 2026 is that these products are now sitting in front of admin consoles for AD, virtualization fabric, content pipelines, and code repositories, so a successful exploit buys lateral movement at supervisor level.
The newcomer: LiteLLM
LiteLLM — the open-source LLM-proxy used in front of
OpenAI, Anthropic, and self-hosted model endpoints —
picked up two KEV adds in the last 365 days, off only
17 published CVEs. That is one of the highest
per-CVE exploitation rates in the list (~12%), in the same
tier as Citrix. The two are a CWE-89 SQL-injection
and a CWE-78 OS-command-injection bug in the
gateway’s admin / model-routing logic. It’s the first time a
product in the AI infrastructure stack has landed in the
top exploitation tier, and it almost certainly won’t be
the last — vector databases, model gateways, and
evaluation harnesses all share the LiteLLM profile (small
team, big install base, network-facing, authorization
written in a hurry).
The full ranking
Ranked by KEV adds in the last 365 days. Counts in parentheses are total CVEs published over the last 24 months — the gap between the two columns is the per-CVE exploitation rate.
| # | Vendor | KEV (365d) | CVEs (24mo) | Cluster | Signature CWE | Top product |
|---|---|---|---|---|---|---|
| 1 | Microsoft | 40 | 4,524 | Endpoint OS | CWE-416 use-after-free | Windows |
| 2 | Apple | 19 | 2,793 | Endpoint OS | CWE-416 use-after-free | macOS / iOS |
| 3 | 13 | 2,369 | Endpoint OS | CWE-416 use-after-free | Chrome / Android | |
| 4 | Cisco | 13 | 442 | Edge appliance | CWE-78 OS-command injection | ASA / IOS XE |
| 5 | Linux Kernel | 11 | 9,432 | Endpoint OS | CWE-476 null-deref | Linux kernel |
| 6 | Fortinet | 7 | 368 | Edge appliance | CWE-78 OS-command injection | FortiOS / FortiManager |
| 7 | Debian | 7 | 769 | Endpoint OS | CWE-416 use-after-free | Debian Linux |
| 8 | Citrix | 4 | 30 | Edge appliance | CWE-269 privilege mgmt | NetScaler ADC / Gateway |
| 9 | Ivanti | 4 | 237 | Edge appliance | CWE-89 SQL injection | Connect Secure / Policy Secure |
| 10 | SolarWinds | 4 | 57 | Enterprise app | CWE-22 path traversal | Access Rights Manager / Web Help Desk |
| 11 | LiteLLM | 2 | 17 | AI stack | CWE-78 OS-command injection | LiteLLM proxy |
| 12 | Oracle | 3 | 678 | Enterprise app | CWE-284 improper access | MySQL / VirtualBox |
| 13 | Adobe | 3 | 1,500 | Enterprise app | CWE-79 XSS | Experience Manager / Magento |
| 14 | Siemens | 3 | 330 | Edge appliance | CWE-89 SQL injection | Telecontrol / SCALANCE |
| 15 | VMware | 3 | 83 | Enterprise app | CWE-79 XSS | Cloud Foundation |
Access beats volume
The single most useful chart to draw from this list is KEV adds per published CVE. Linux ships 9,432 CVEs in 24 months and 11 of them are exploited — a ratio of 0.12%. Citrix ships 30 and gets 4 exploited — 13.3%, more than 100× higher. Adobe sits at 0.2%, Microsoft at 0.9%, Cisco at 2.9%, Fortinet at 1.9%, Ivanti at 1.7%, SolarWinds at 7%, and LiteLLM at 11.8%.
The headline metric isn’t how many CVEs you publish. It’s how many of those CVEs unlock something attackers want — an edge appliance with VPN sessions behind it, an admin console with control of the virtualisation fabric, or an authentication proxy in front of every model call.
What this implies for defenders
If you’re building a vendor-risk view from the inside, a headcount of CVEs across your installed base is the wrong signal. The right signal is: how many of those CVEs are in edge appliances, endpoint OSes, enterprise admin apps, and now AI gateways? The four buckets in the top-15 list account for almost all exploitation leverage. Inventory by cluster, not by vendor count.
The controls that matter differ by cluster.
- Endpoint OS. Prevention here is a patch-cadence game: these are the auto-updating, Patch-Tuesday products, so the only real lever is how fast you close the update window. Layer exploit mitigations that raise the cost of turning a use-after-free into code execution — turn on Windows Exploit Protection / hardware-enforced stack protection (CET), ASLR and CFG; run browsers and document viewers with site isolation and sandboxing; and strip local-admin rights. Memory-safety prevention is never complete, so lean on EDR to catch the post-exploitation step.
- Edge appliances. Stop treating the management interface as something you pull off the internet when an advisory drops — take it off now. The admin / management plane of a Fortinet, Citrix, or Ivanti box should not be reachable from the public internet at all; put it behind private access — a zero-trust / ZTNA broker, a jump host, or a management VLAN reachable only over VPN — so the next pre-auth bypass lands on a listener the attacker can’t reach. The data plane (VPN / IPsec termination) still has to face the internet; the management plane never does. Where exposure is genuinely unavoidable, the residual SLA is internet-exposure latency: how fast you can pull the interface once an advisory drops.
- Enterprise / management apps. A WAF earns its keep for part of this cluster. Reflected XSS and path-traversal / injection payloads have signatures, so a WAF — or the product’s own virtual-patching rules — can block them and buy time before you patch. But a WAF is not designed to address broken-access-control and authorization bugs (CWE-284, CWE-863) that also fill this cluster: those requests look legitimate, so there is no payload to match — only the patch and proper authorization checks close them. So treat WAF as a mitigating solution that requires additional action: behind it, pull these admin consoles (SolarWinds, vCenter, Oracle EM, AEM) off the public internet on the same logic as the edge boxes, enforce MFA on every admin path, and segment them from the fabric they control.
- The LiteLLM cohort. You don’t yet have a mature CVSS-vs-EPSS picture for AI-stack proxies. The right move is to treat any AI-stack proxy as an Edge appliance by default — keep its admin and model-routing endpoints off the public network from day one, behind the same private-access broker.
Data: vendor_cve_stats +
kev_catalog in MongoDB; vendor table snapshot
2026-06-08, headline KEV share recomputed 2026-07-03. For the
headline share, KEV vendor names are normalised to the vendors
named here (Broadcom’s VMware products → VMware,
BerriAI → LiteLLM, Android → Google).
Cluster assignment is mine, not CISA’s. The full per-vendor
research pages, including 24-month volume sparklines and KEV
detail tables, live at
/vendor-compare.html.