Embeddable widgets
Drop a live security-resilience.ai widget into a Barracuda blog post. Each refreshes from our daily data on its own — embed once, stays current. Clicks open the full page in a new tab. Last updated: 16 October 2026 12:22 UTC
AI Hype Index
The live AI Hype Index — score, 10-day trend, and the record-year takeaway.
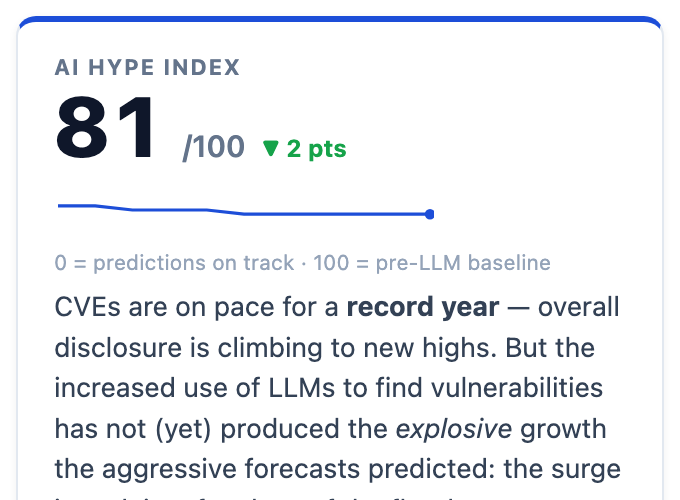
<iframe src="https://security-resilience.ai/embed/hype.html" width="340" height="335" style="border:0;max-width:100%" loading="lazy" title="AI Hype Index - security-resilience.ai"></iframe>
Top CVEs to act on
This week’s highest-risk CVEs (KEV + EPSS movers + fresh criticals), each linking to its full detail page.
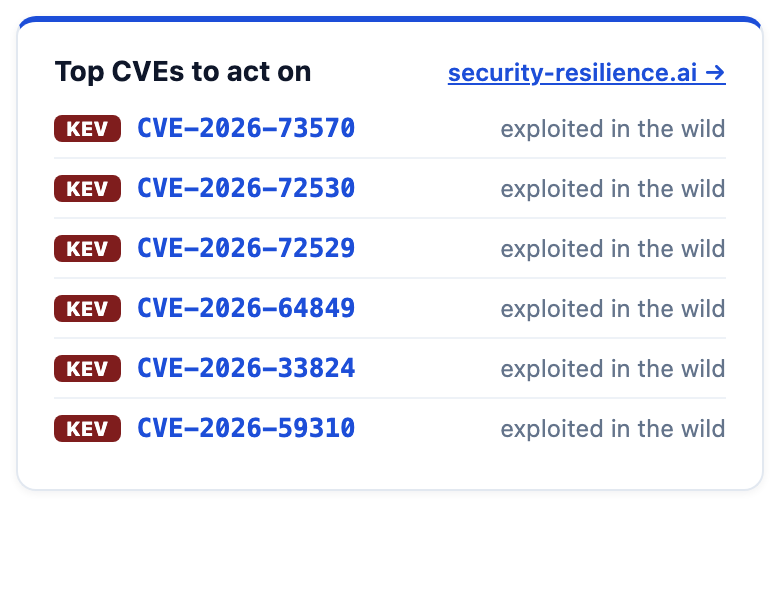
<iframe src="https://security-resilience.ai/embed/top-cves.html" width="380" height="300" style="border:0;max-width:100%" loading="lazy" title="Top CVEs to act on - security-resilience.ai"></iframe>
Observed threat map
The live daily threat map — countries shaded by the attack volume we can actually observe (leak-site claims, filings, reporting), refreshed every day. Nav-free; clicks open the full interactive map.
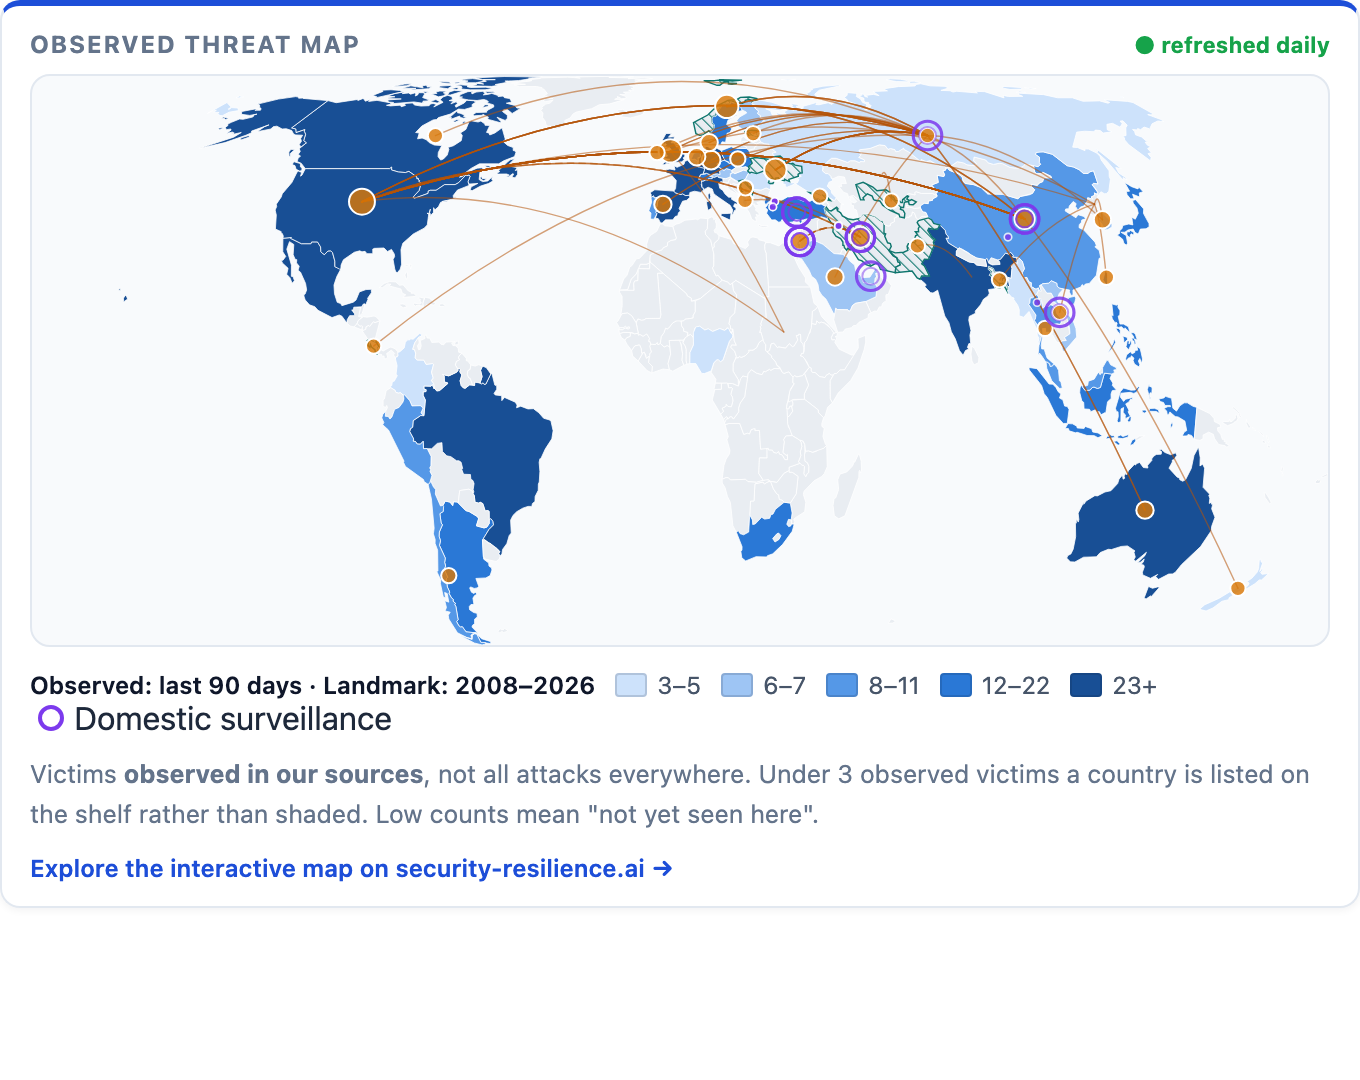
<iframe src="https://security-resilience.ai/embed/threat-map.html" width="680" height="540" style="border:0;max-width:100%" loading="lazy" title="Observed threat map - security-resilience.ai"></iframe>
Interactive model: how LLMs change the CVE landscape
The interactive Mythos model of how large language models shift the vulnerability landscape. Explore the four scenarios and the drivers behind each.
Preview shown at 40% — the embed code below is full size.
<iframe src="https://security-resilience.ai/mythos_viz.html" width="1040" height="1220" style="border:0;max-width:100%" loading="lazy" title="Interactive model: how LLMs change the CVE landscape - security-resilience.ai"></iframe>
Monthly CVE publication volume
New CVEs published per month, with the AI-related share on its own right-hand axis. Refreshes daily.
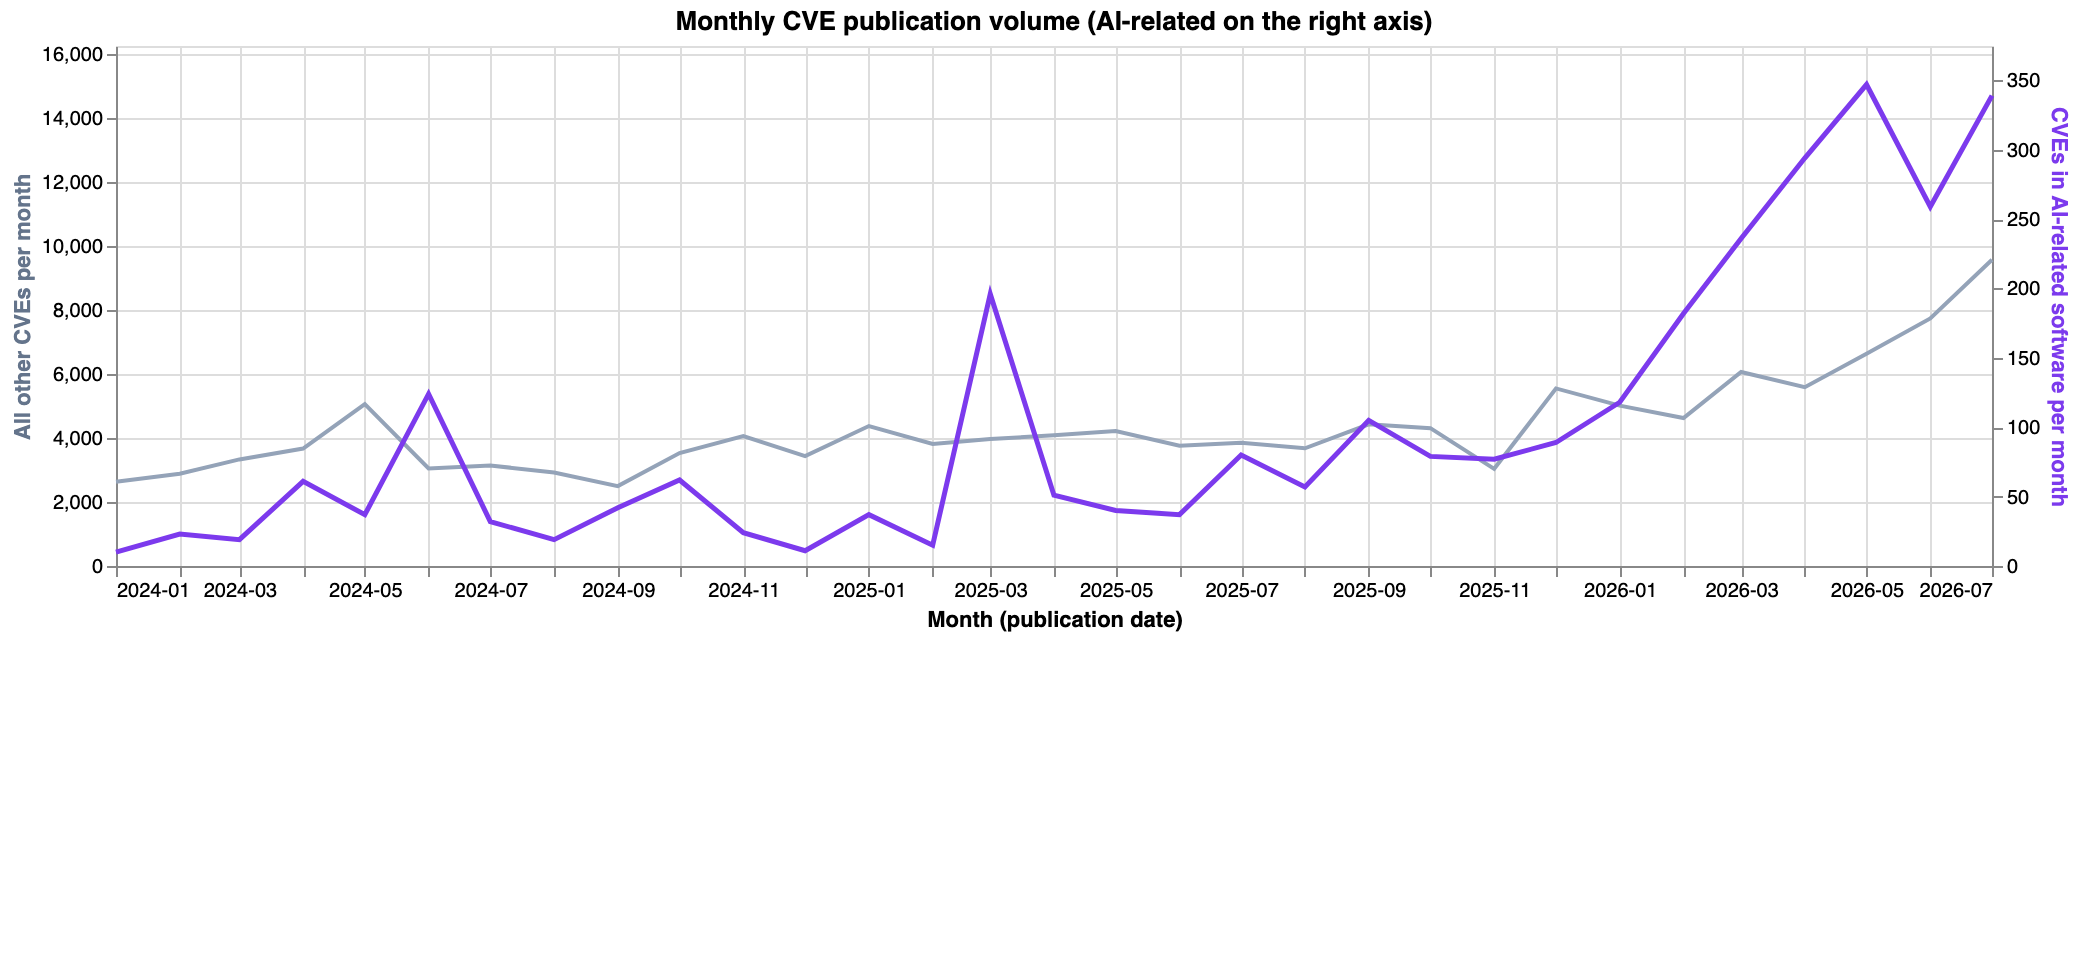
<iframe src="https://security-resilience.ai/staging/trends_volume.html" width="740" height="500" style="border:0;max-width:100%" loading="lazy" title="Monthly CVE publication volume - security-resilience.ai"></iframe>
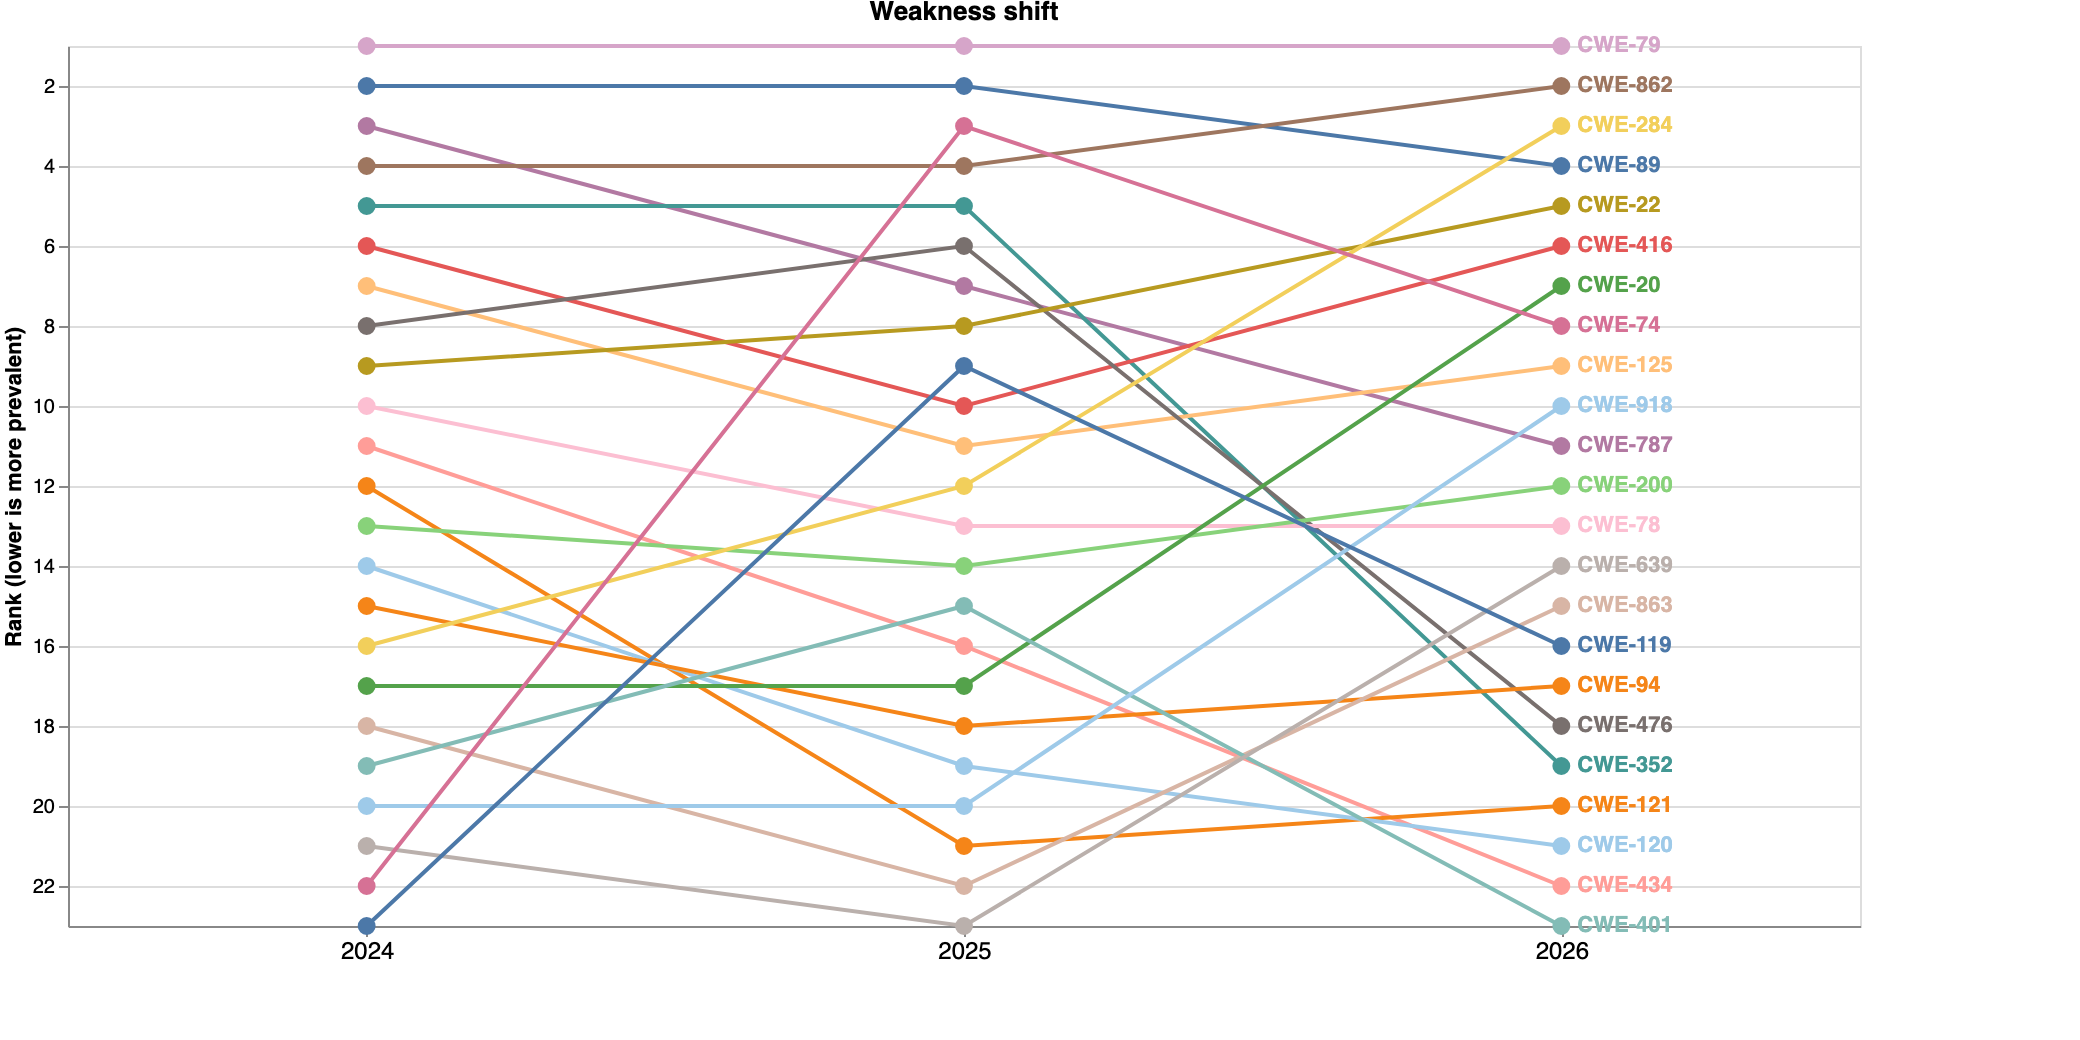
Weakness shift: top CWEs by year
How the most common weakness types rank against each other across 2024, 2025 and 2026 so far.
<iframe src="https://security-resilience.ai/staging/trends_cwe_shift.html" width="740" height="520" style="border:0;max-width:100%" loading="lazy" title="Weakness shift: top CWEs by year - security-resilience.ai"></iframe>
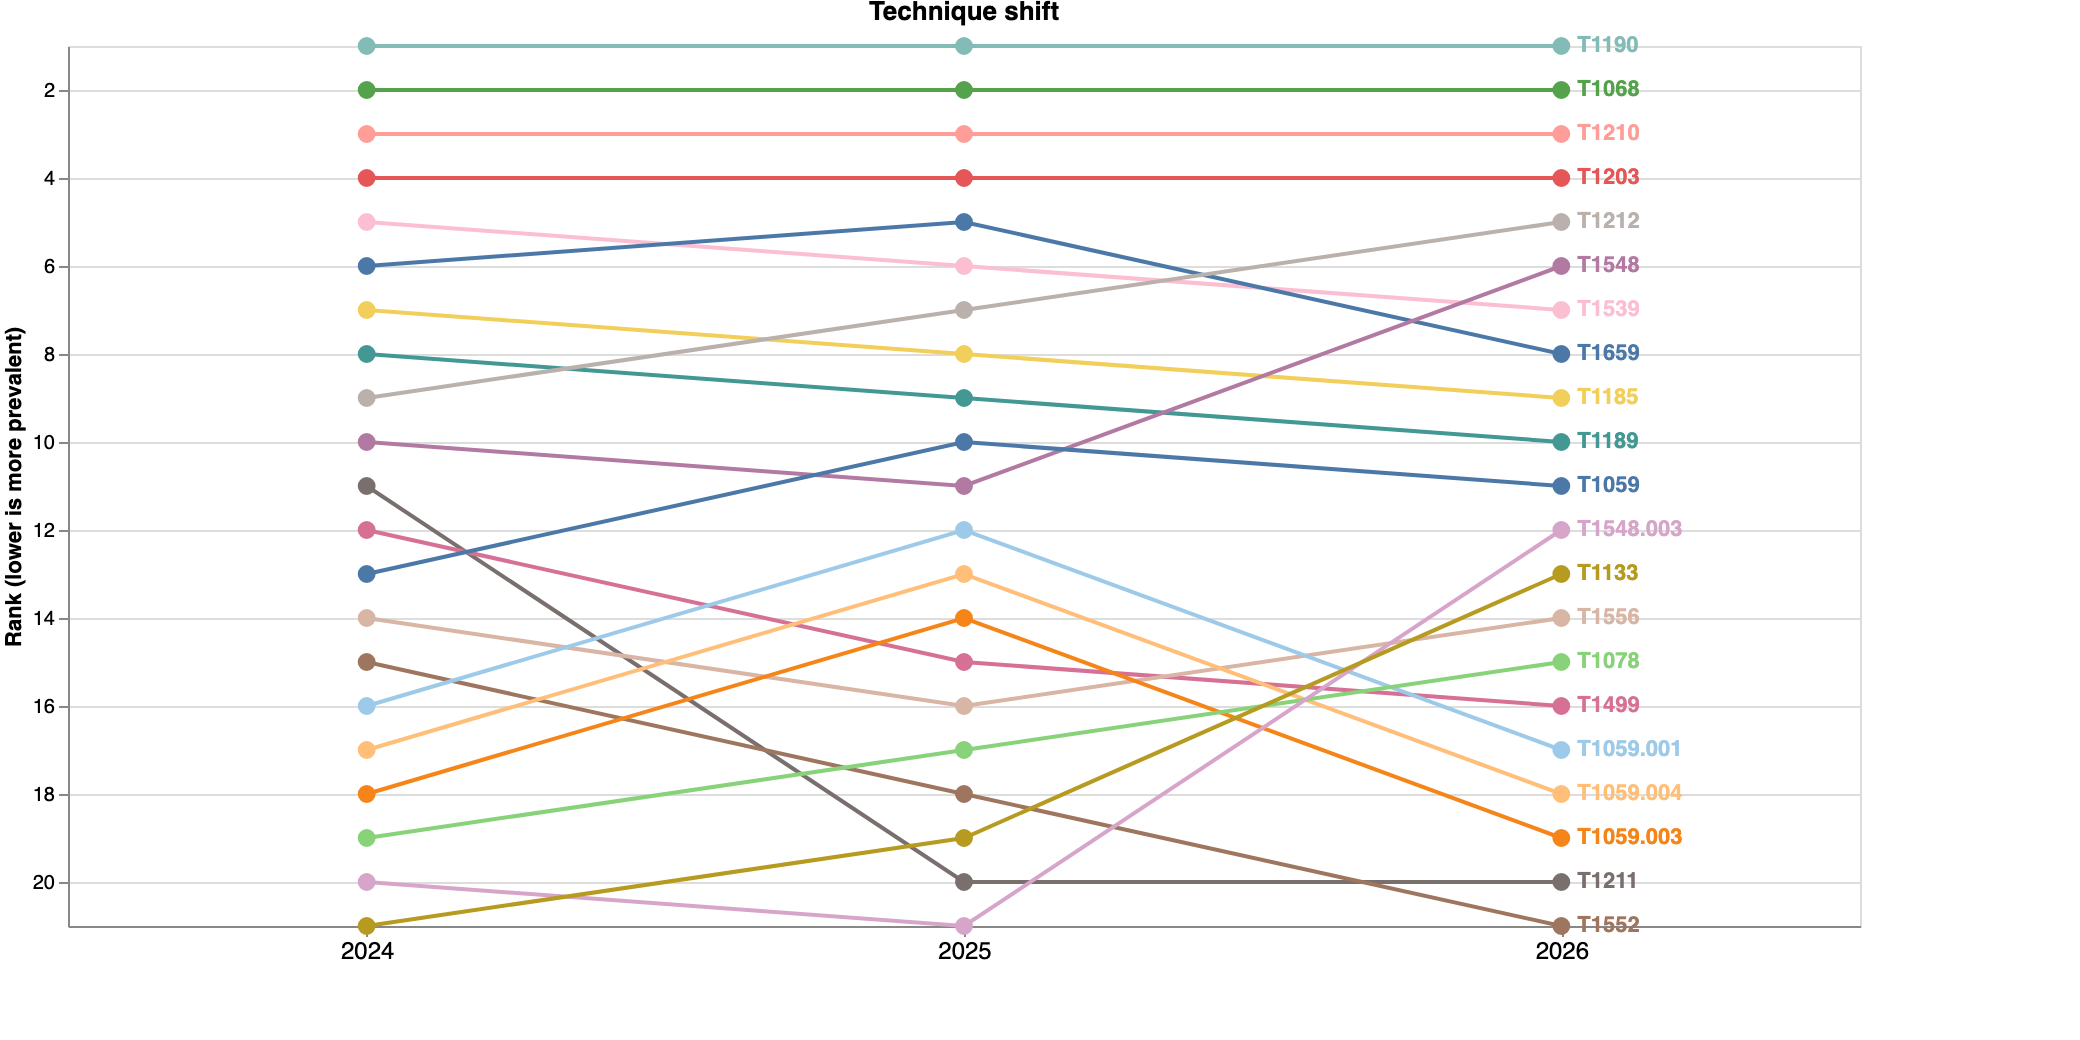
Attacker technique shift
Which MITRE ATT&CK techniques the exploited-CVE population leans on, and how that mix moves over time.
<iframe src="https://security-resilience.ai/staging/trends_technique_shift.html" width="740" height="560" style="border:0;max-width:100%" loading="lazy" title="Attacker technique shift - security-resilience.ai"></iframe>
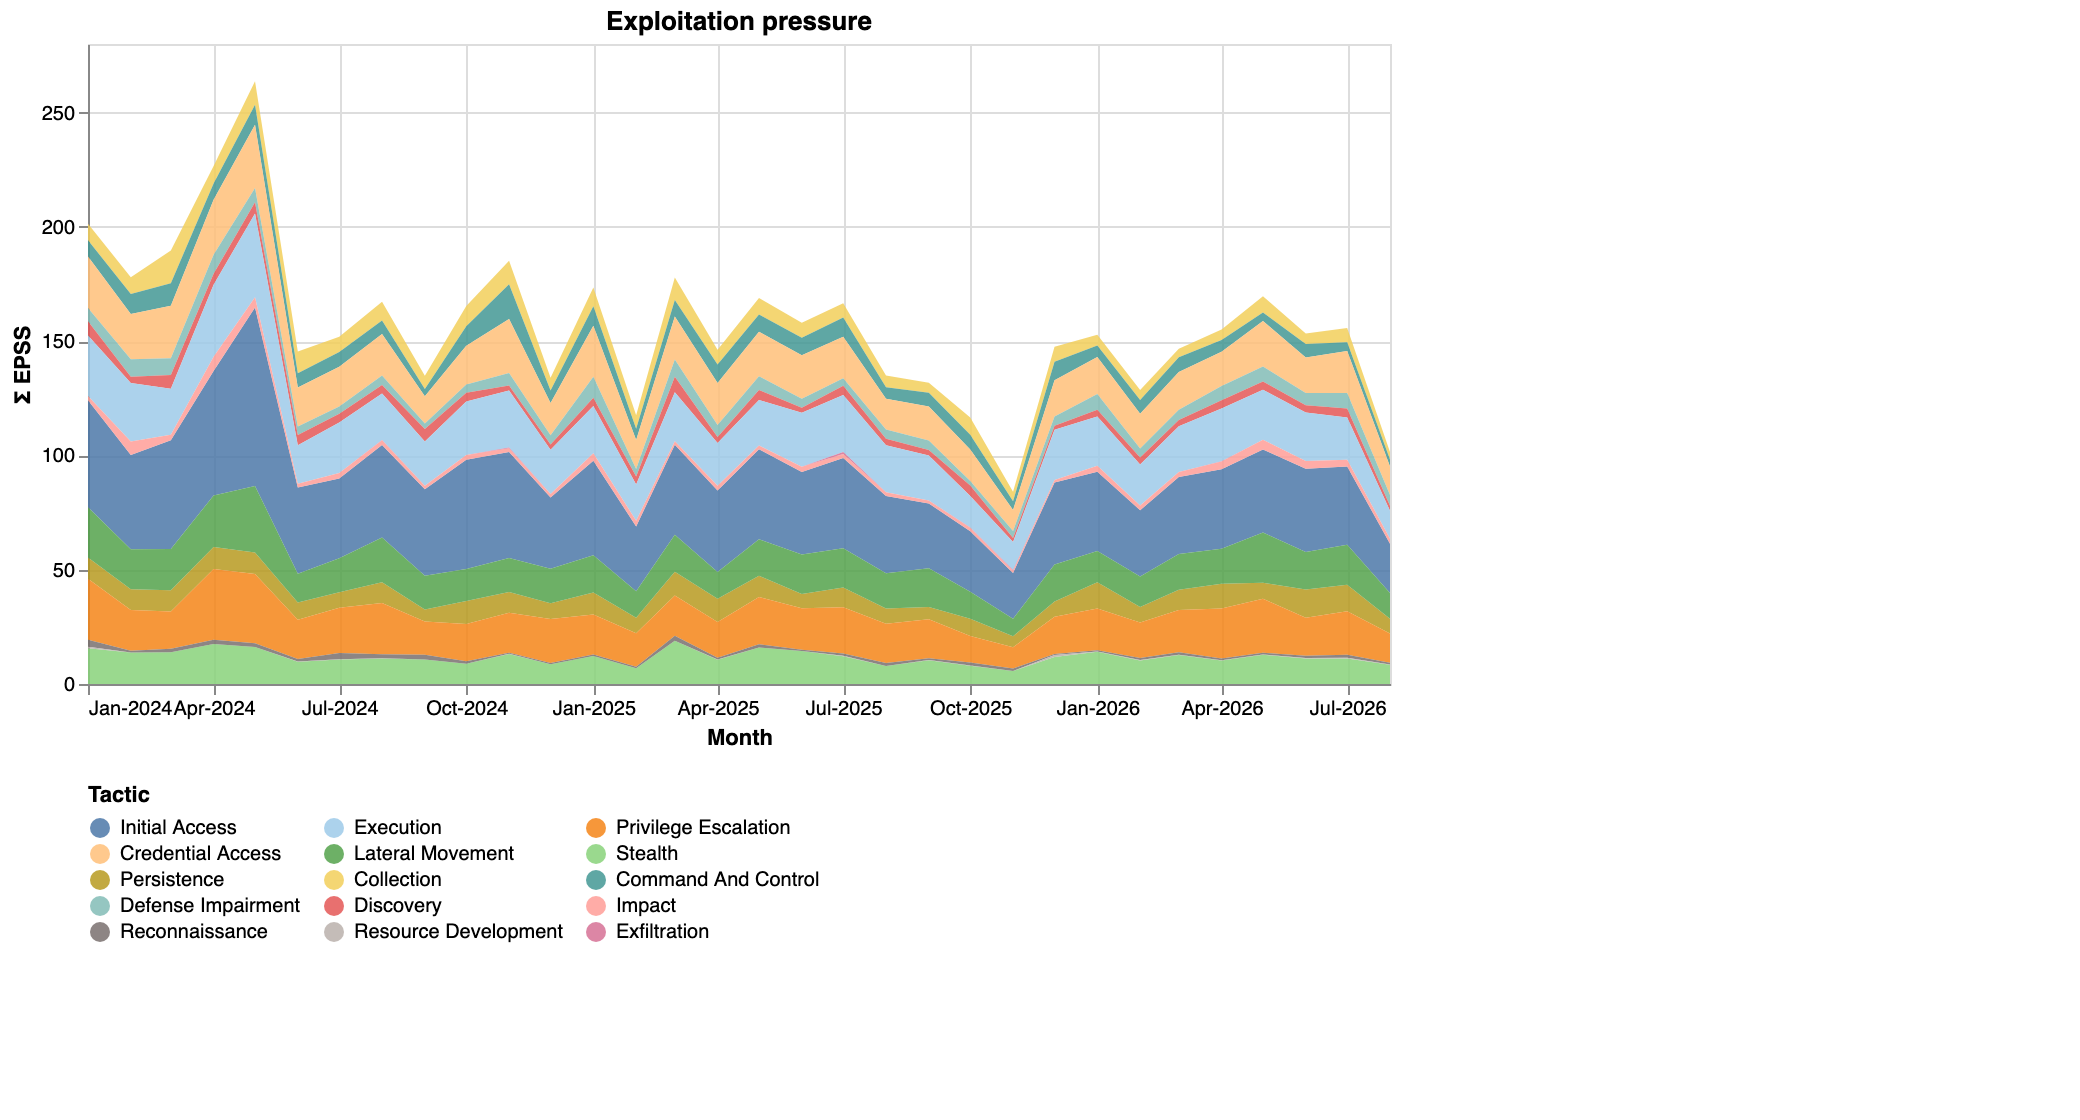
Exploitation pressure by tactic
Summed EPSS exploit-probability by ATT&CK tactic each month. Shows where exploitation pressure concentrates.
<iframe src="https://security-resilience.ai/staging/trends_tactic_pressure.html" width="740" height="580" style="border:0;max-width:100%" loading="lazy" title="Exploitation pressure by tactic - security-resilience.ai"></iframe>
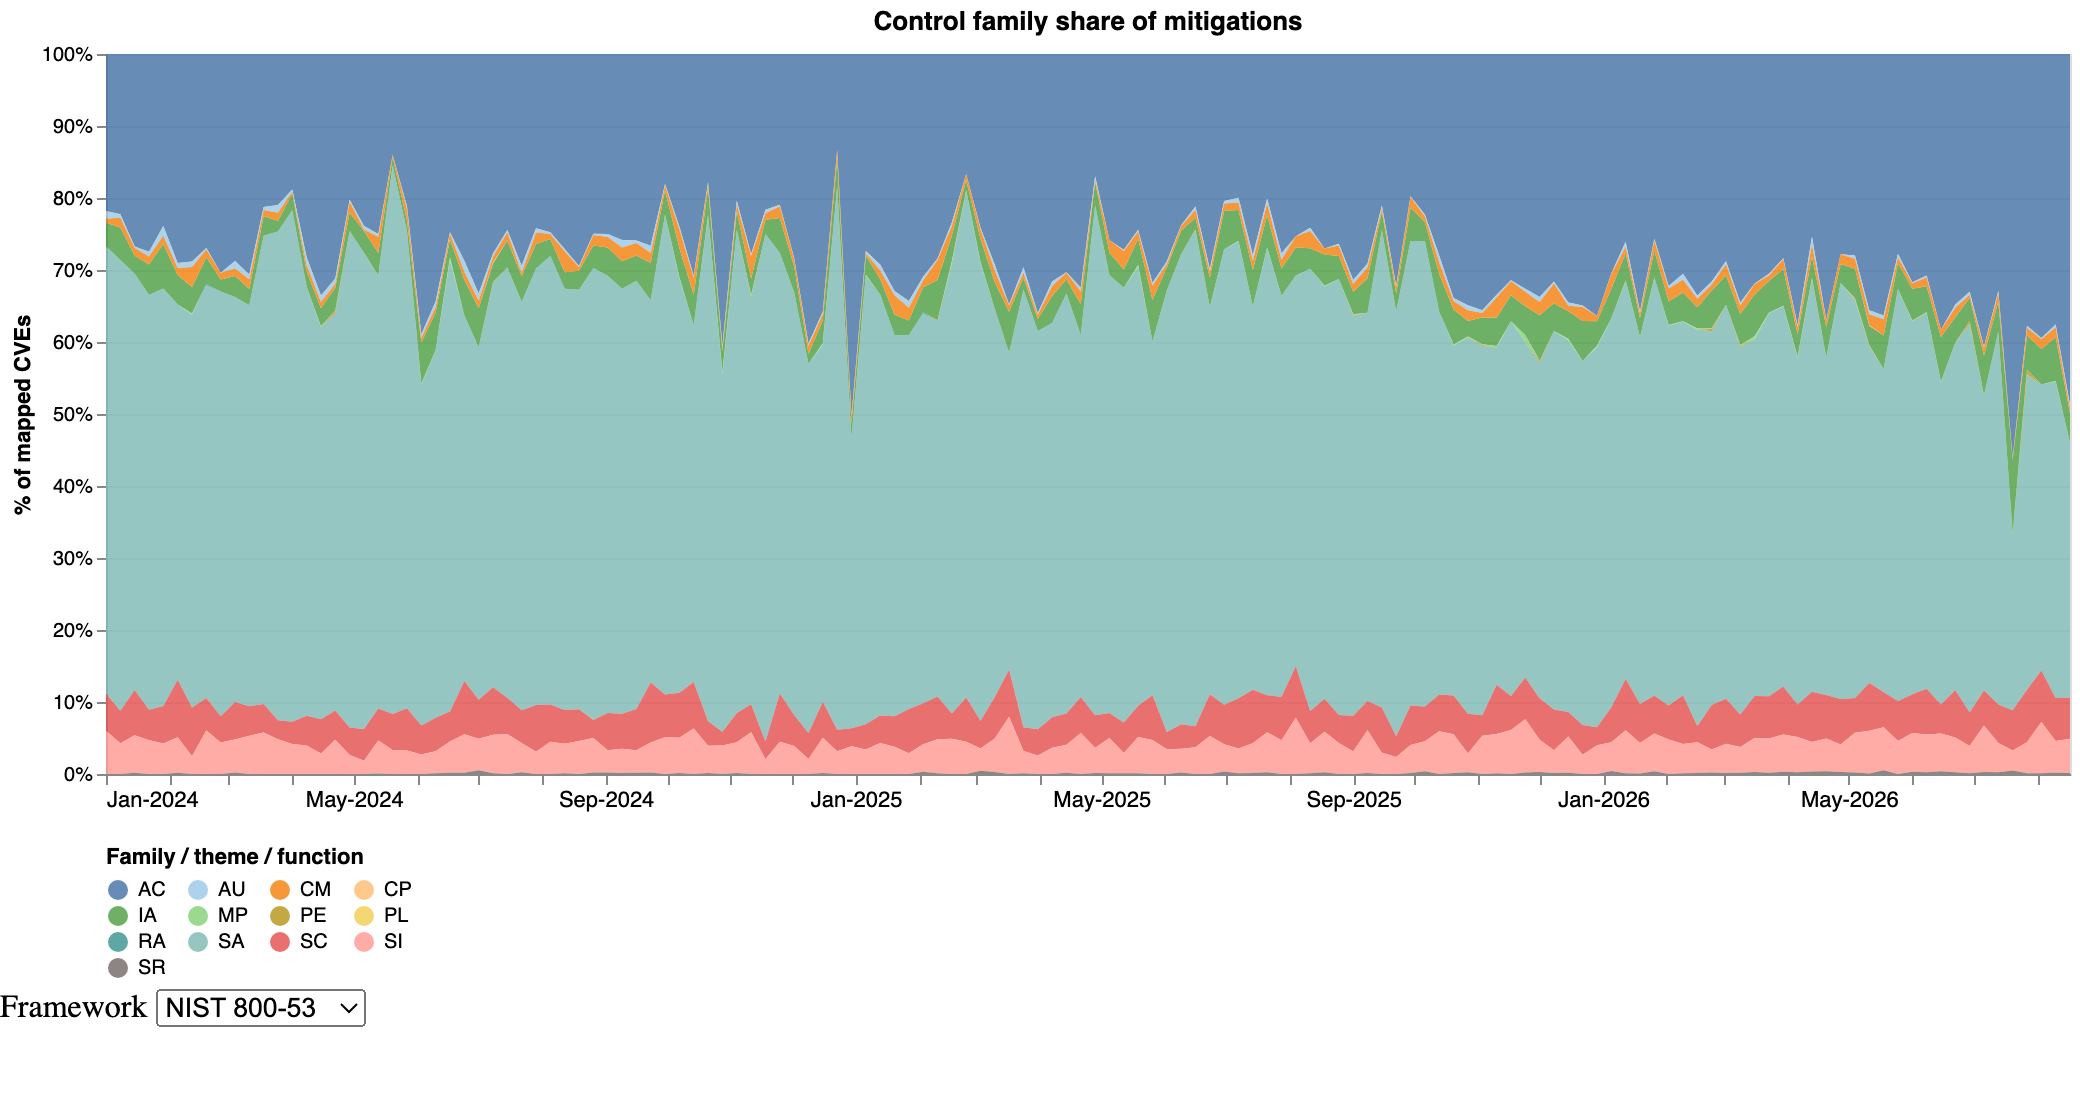
Control family share of mitigations
Which NIST 800-53 control families carry the mitigation load, week by week.
<iframe src="https://security-resilience.ai/staging/trends_control_coverage.html" width="740" height="580" style="border:0;max-width:100%" loading="lazy" title="Control family share of mitigations - security-resilience.ai"></iframe>
More charts, PNG only
<img> or download and drop in.
Every widget above also has its own Download PNG link, so
those are not repeated here.
CVE exploit-pressure (EPSS, 30 days)
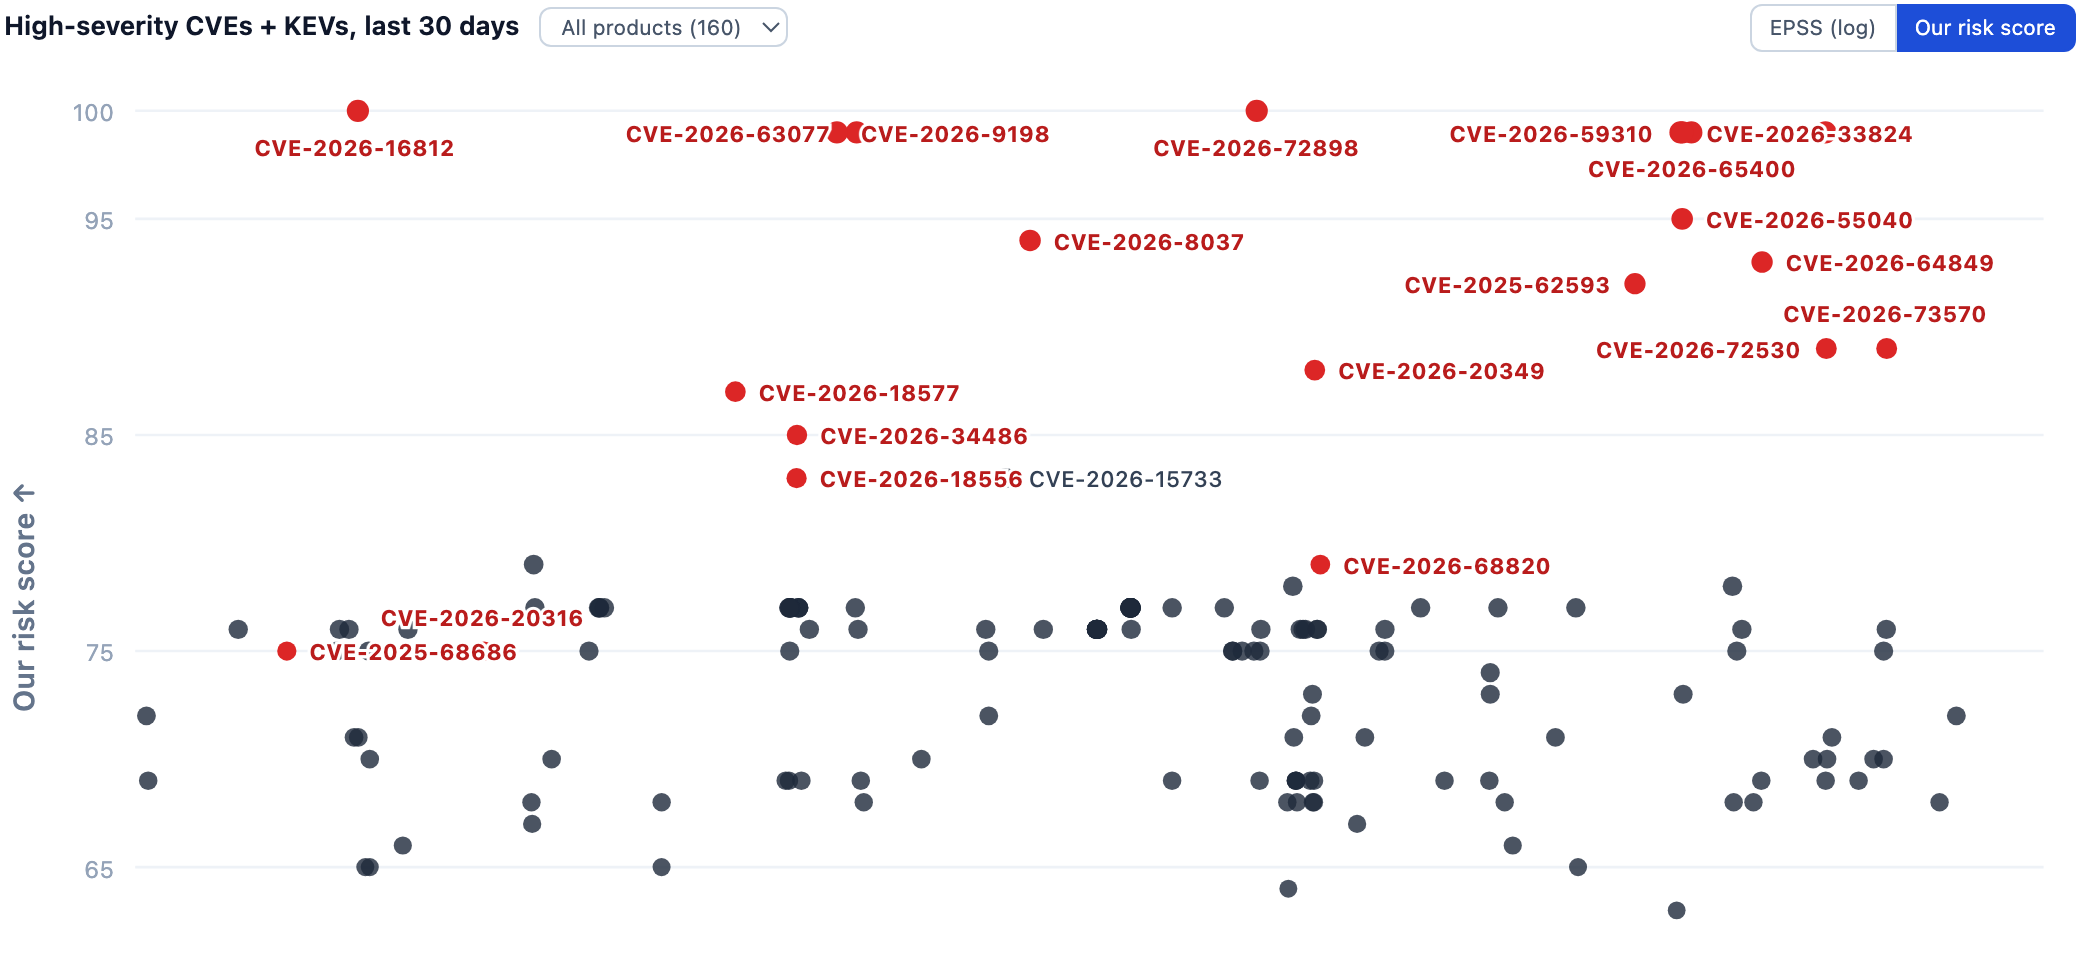
Static PNG — right-click to save, or <img src="https://security-resilience.ai/snapshots/cve-trends.png">.
Exploitation velocity — CISA KEV additions per month
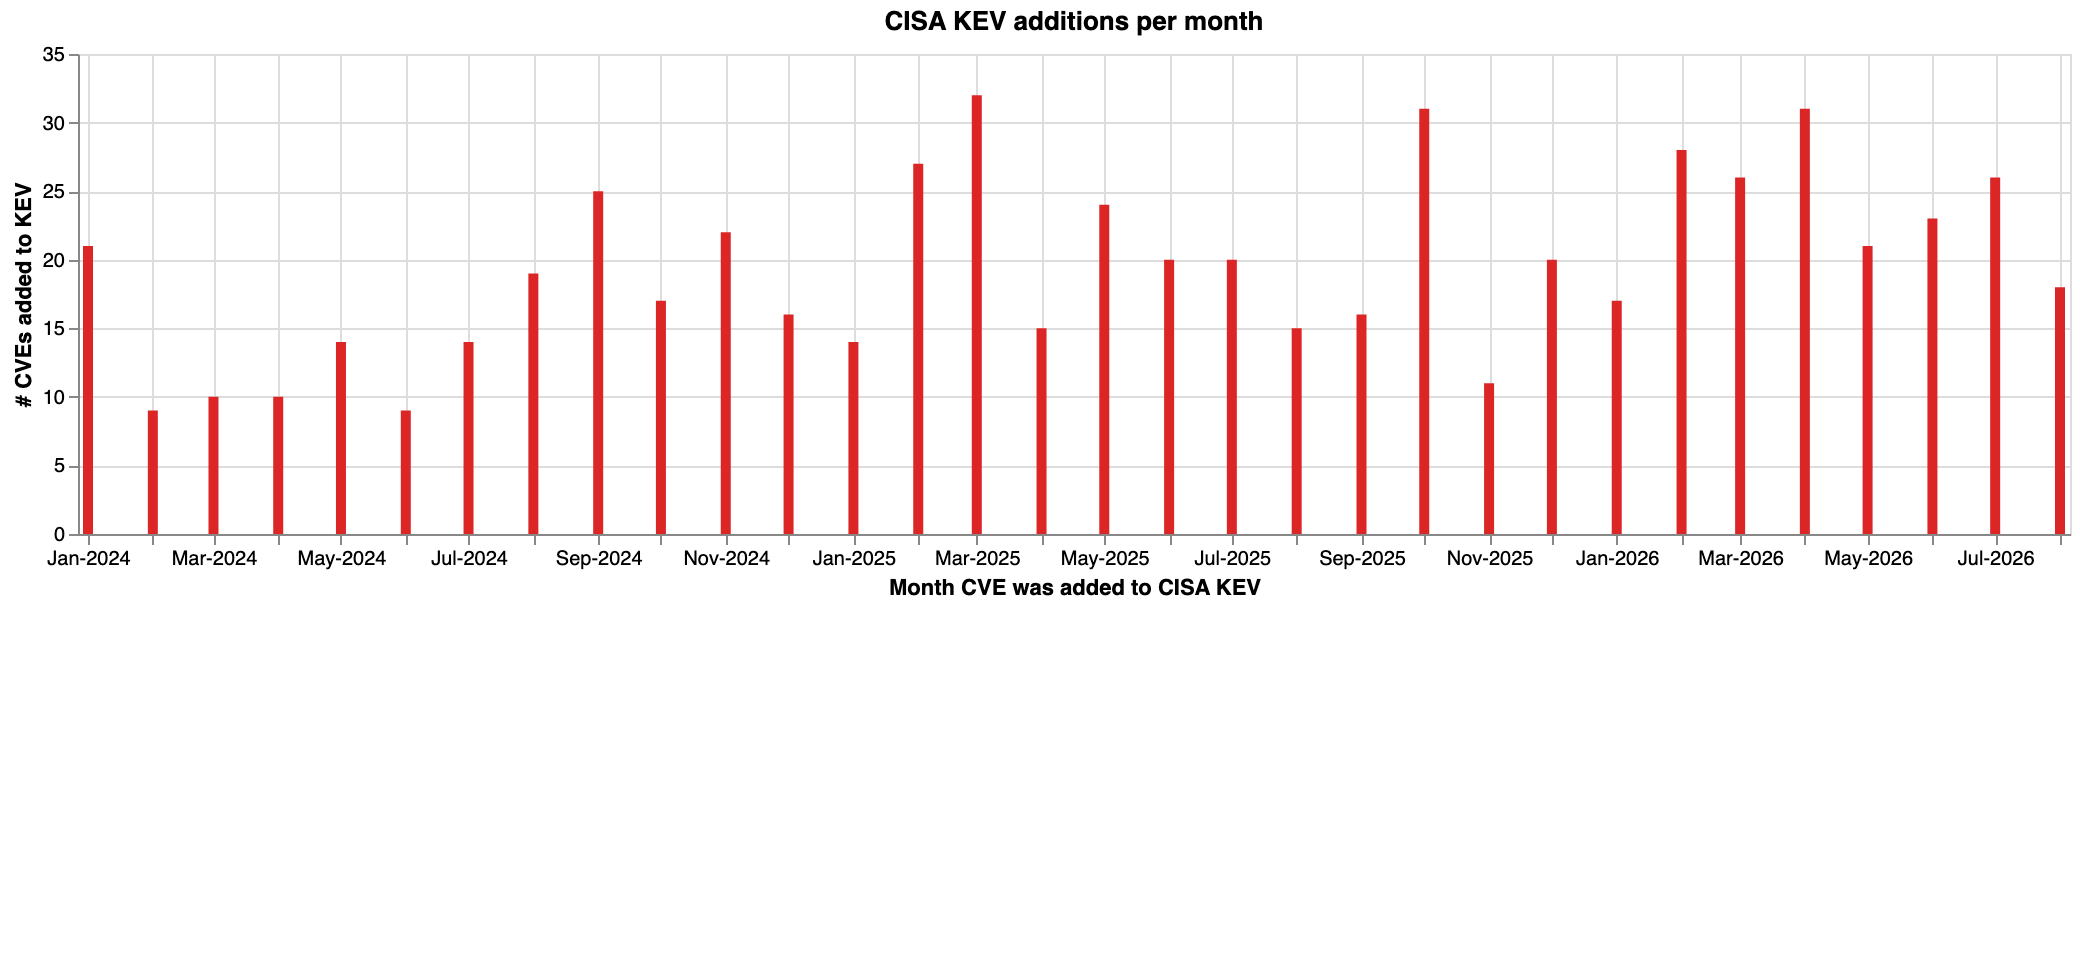
Static PNG — right-click to save, or <img src="https://security-resilience.ai/snapshots/kev-velocity.png">.
Time from CVE publication to KEV listing
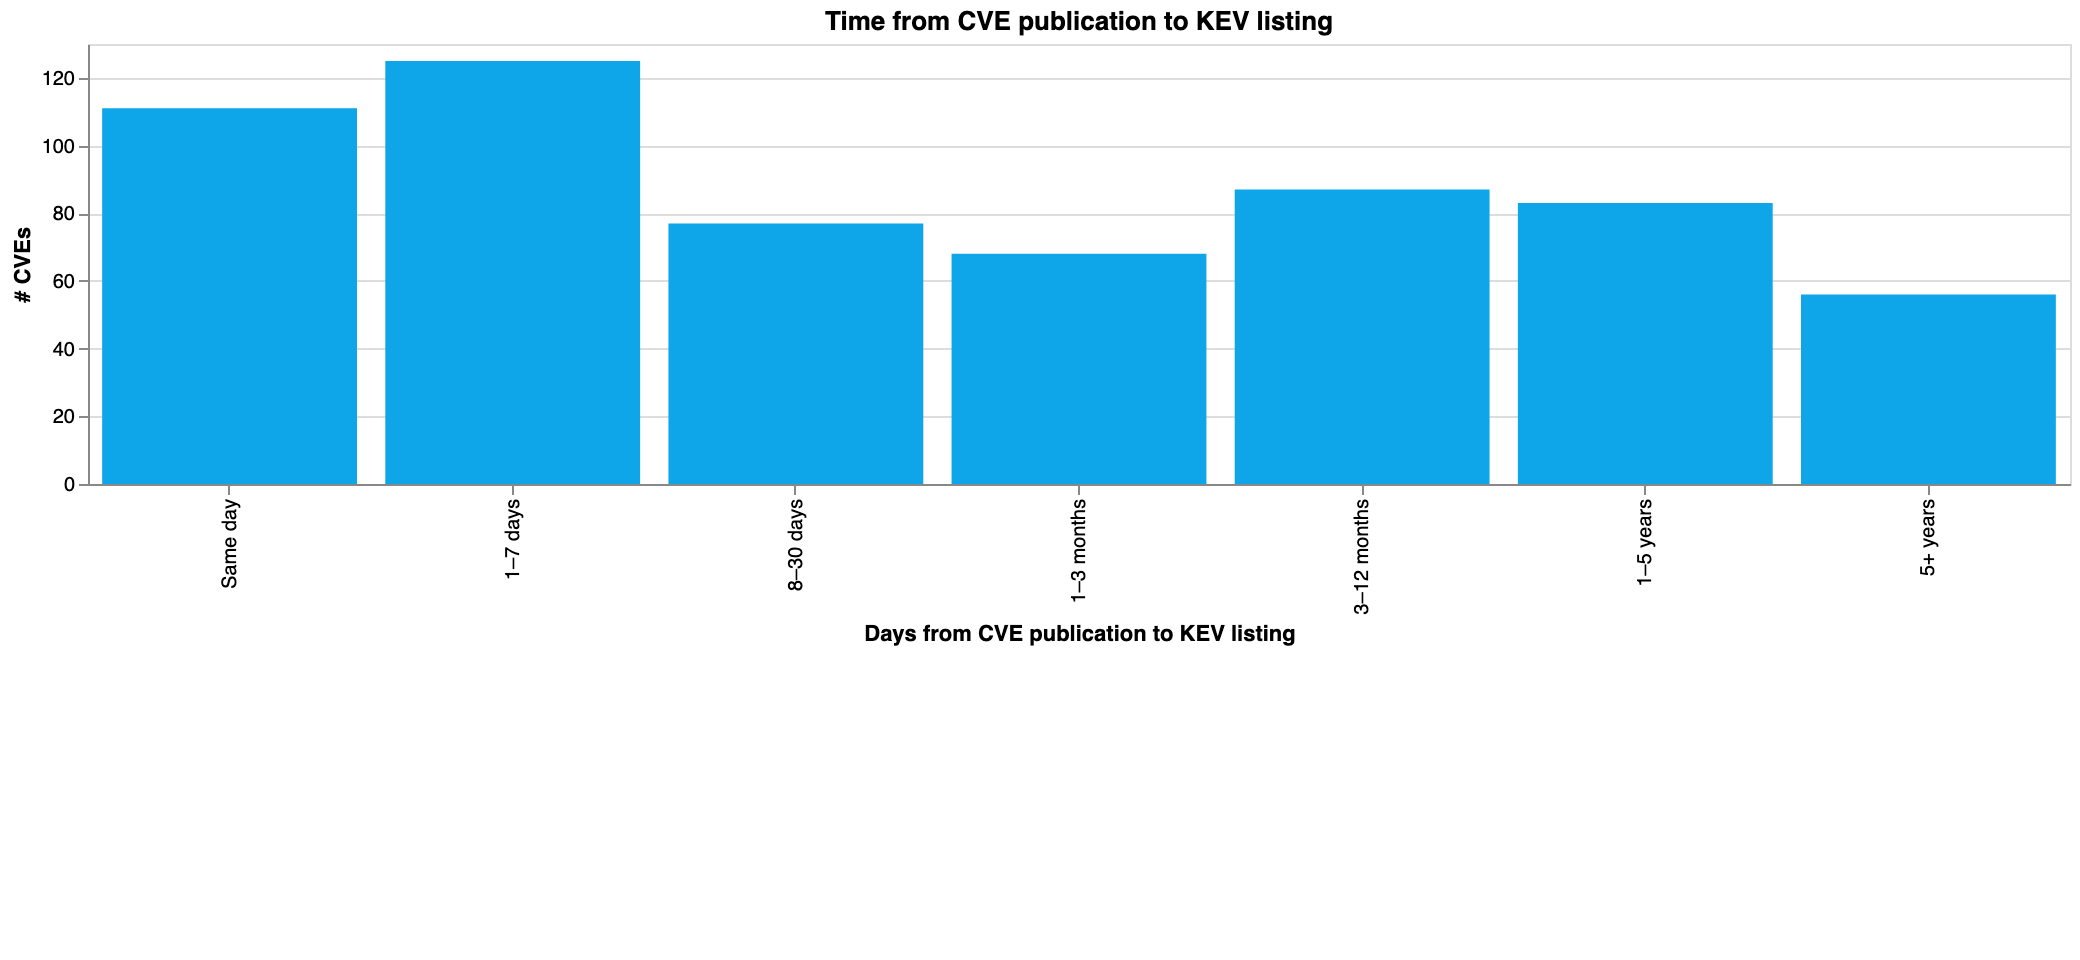
Static PNG — right-click to save, or <img src="https://security-resilience.ai/snapshots/pub-to-kev.png">.
Ransomware-attributed share of KEV, by quarter
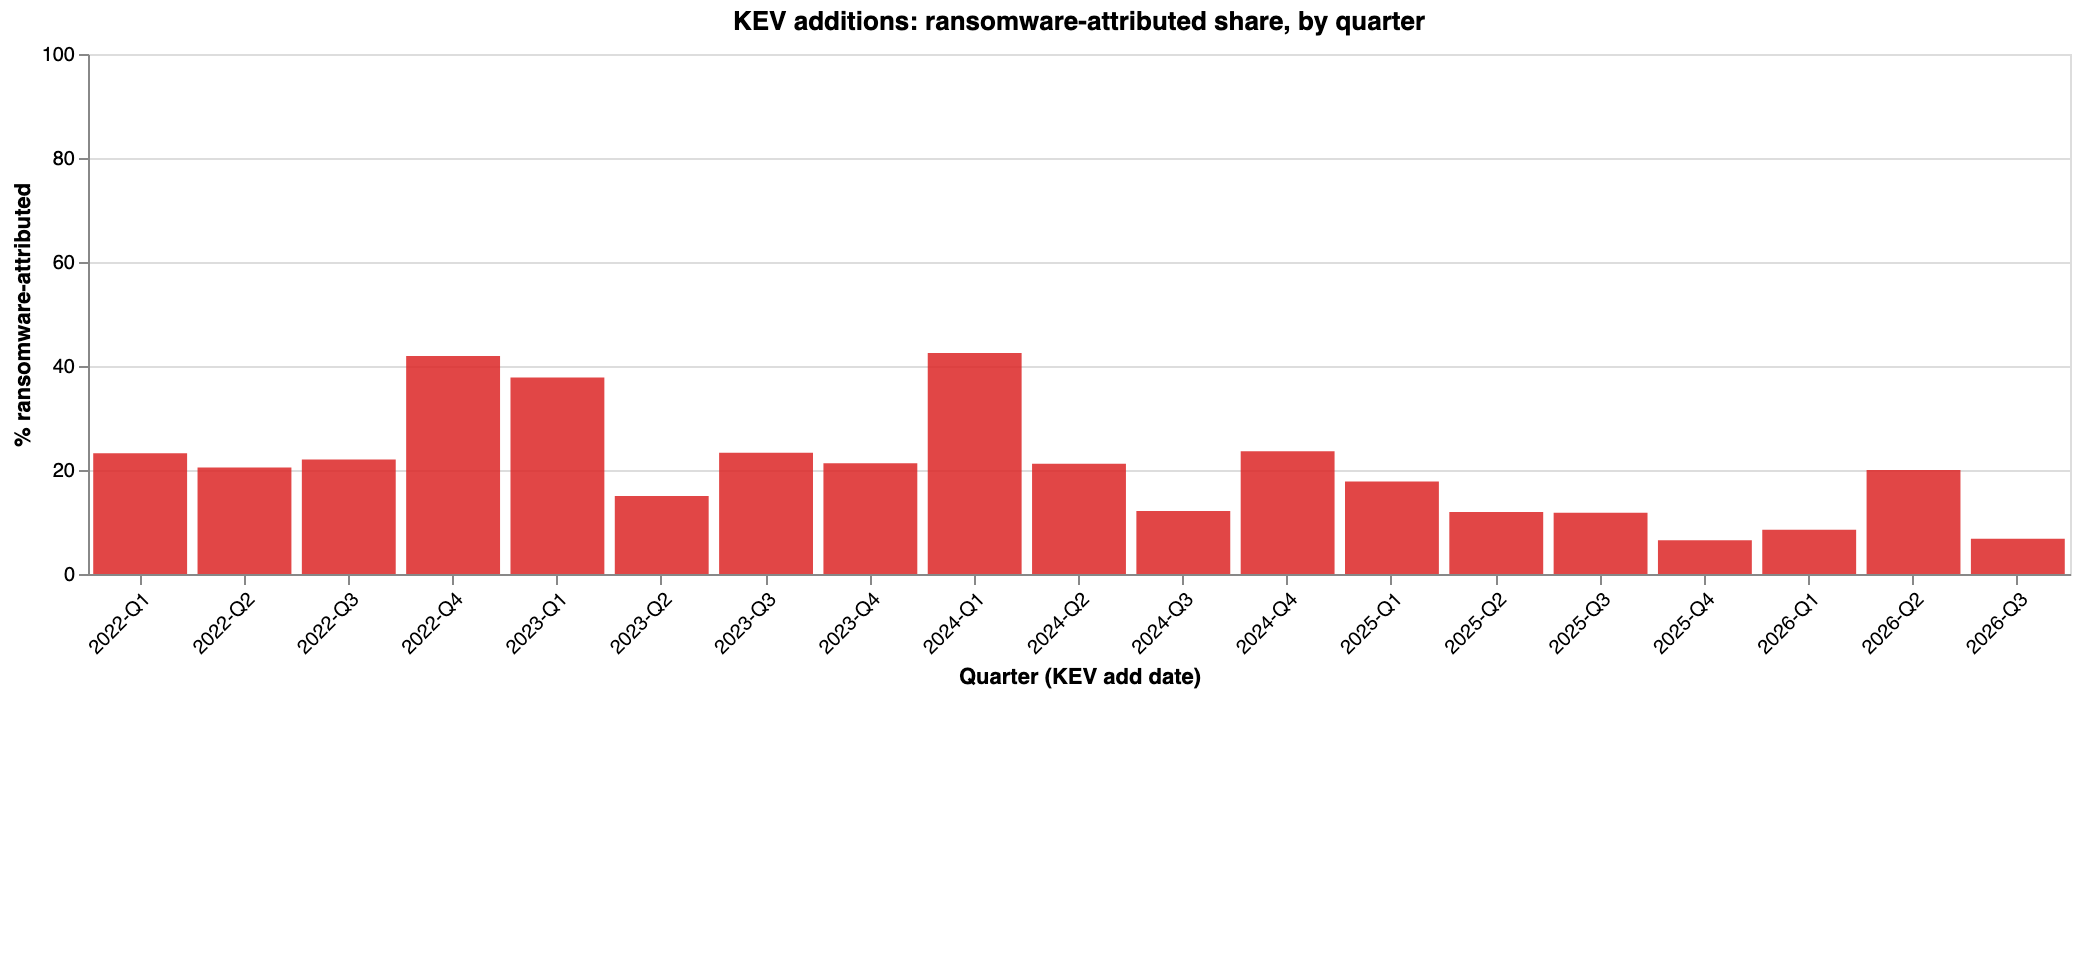
Static PNG — right-click to save, or <img src="https://security-resilience.ai/snapshots/ransomware-kev.png">.
CVE exploit pressure — EPSS over time
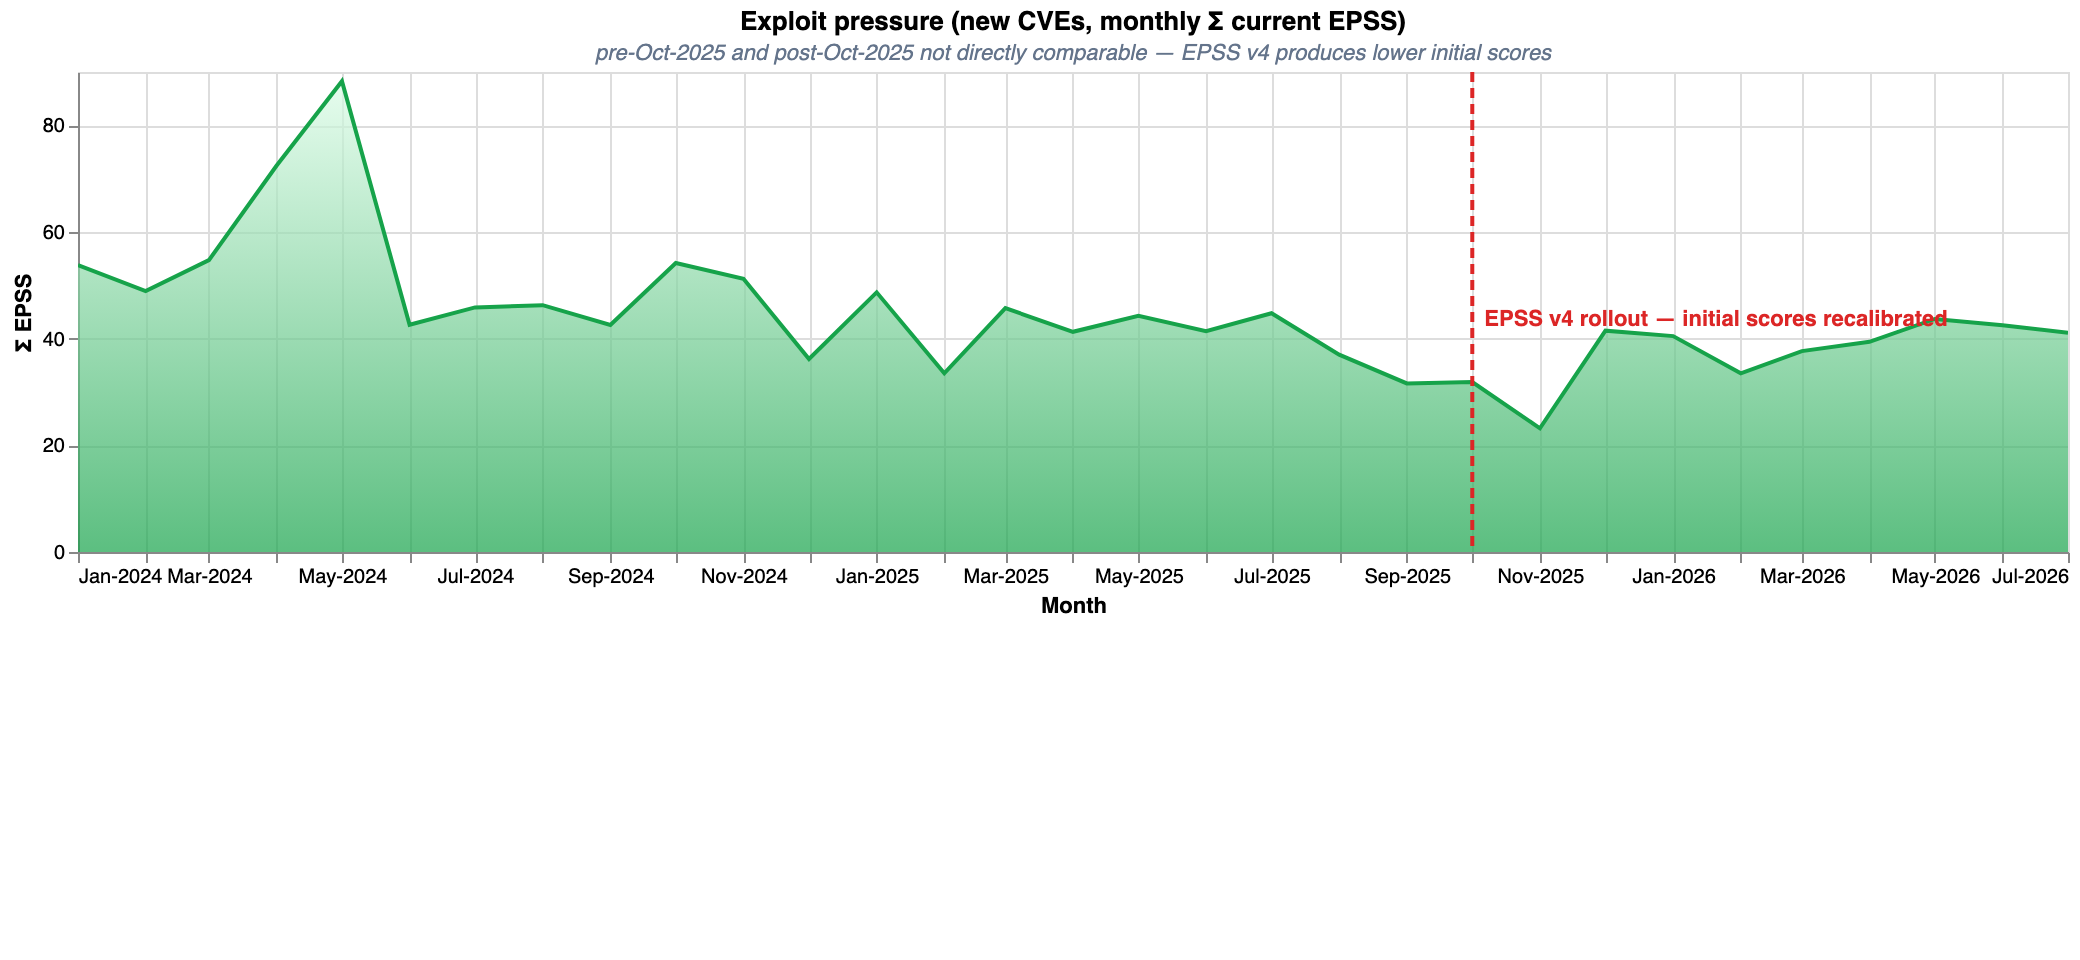
Static PNG — right-click to save, or <img src="https://security-resilience.ai/snapshots/epss-pressure.png">.
The KEV gap — exploited before it’s patched
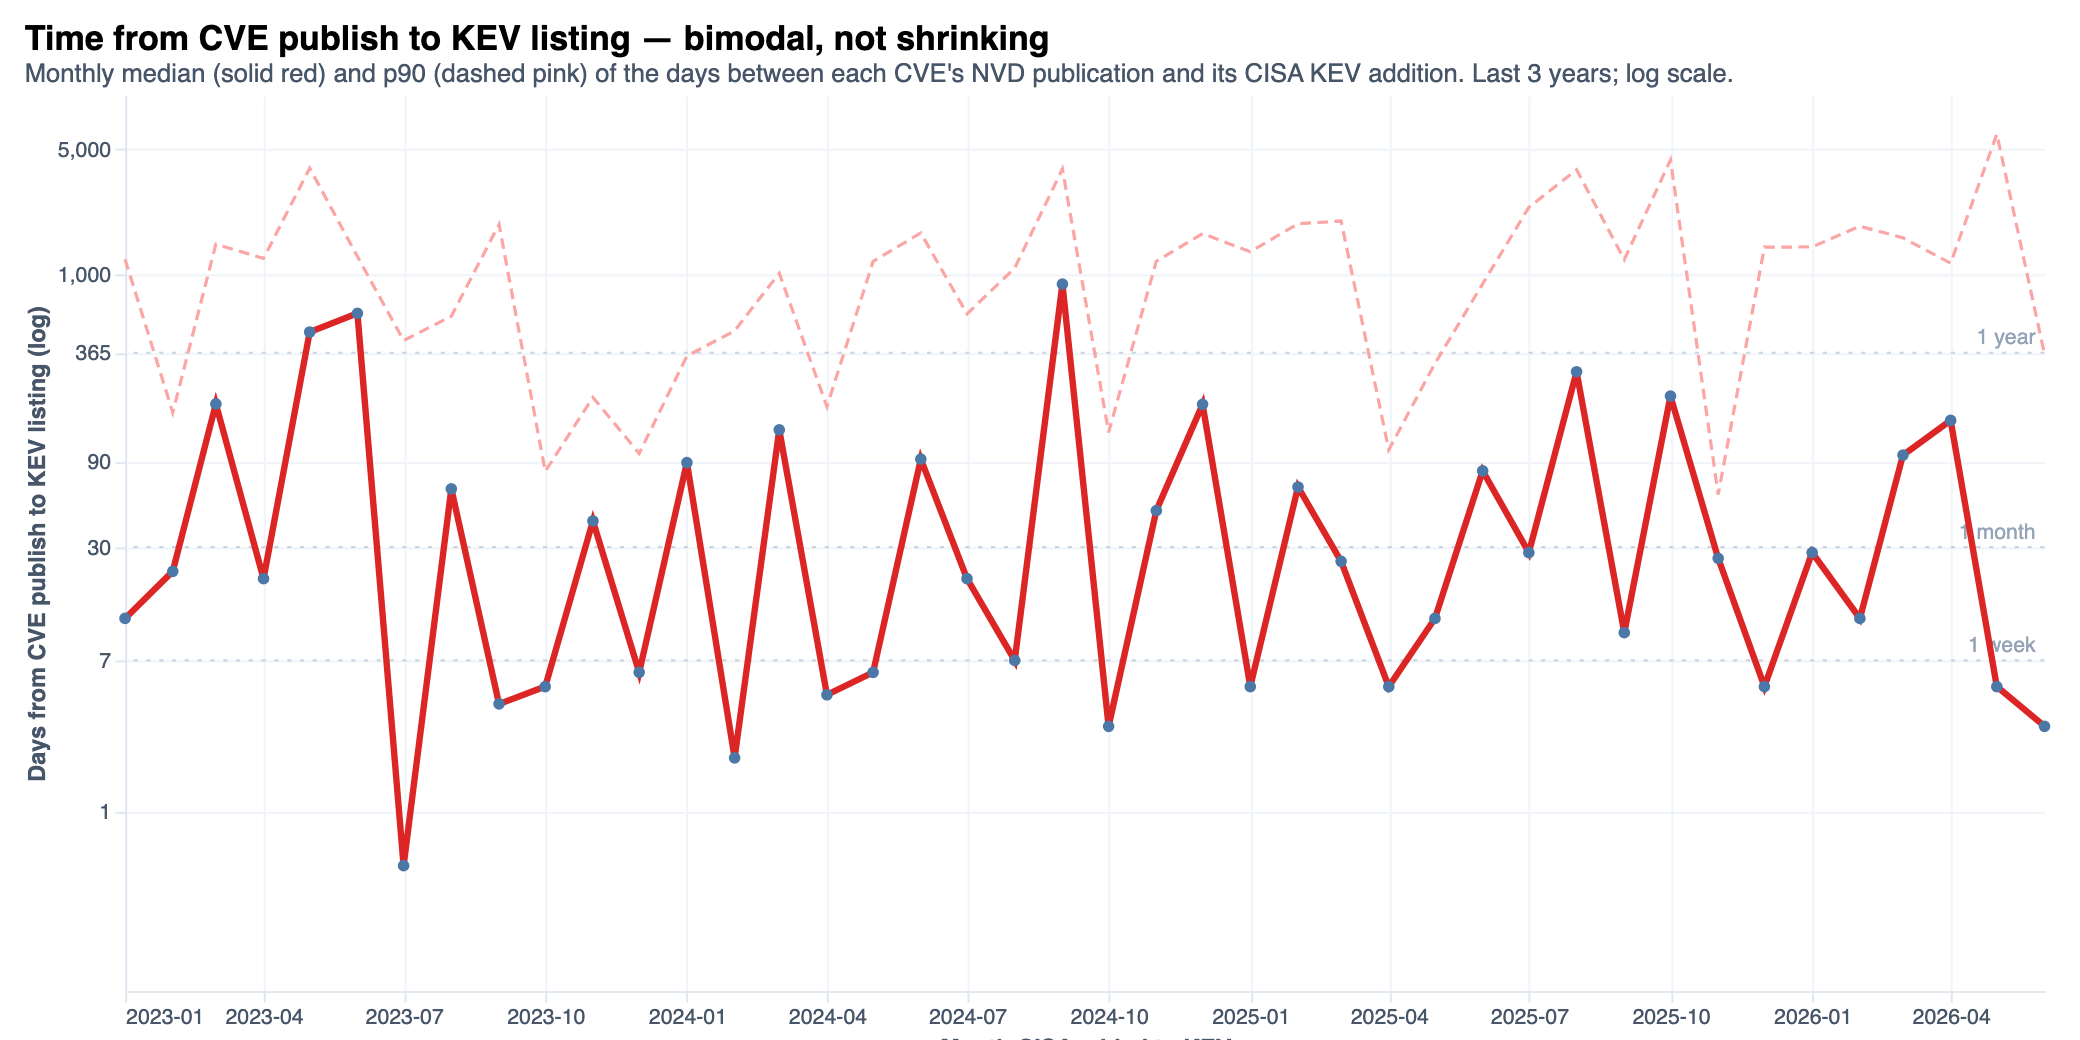
Static PNG — right-click to save, or <img src="https://security-resilience.ai/snapshots/kev-gap.png">.
DBIR breach patterns vs our KEV-gap timing
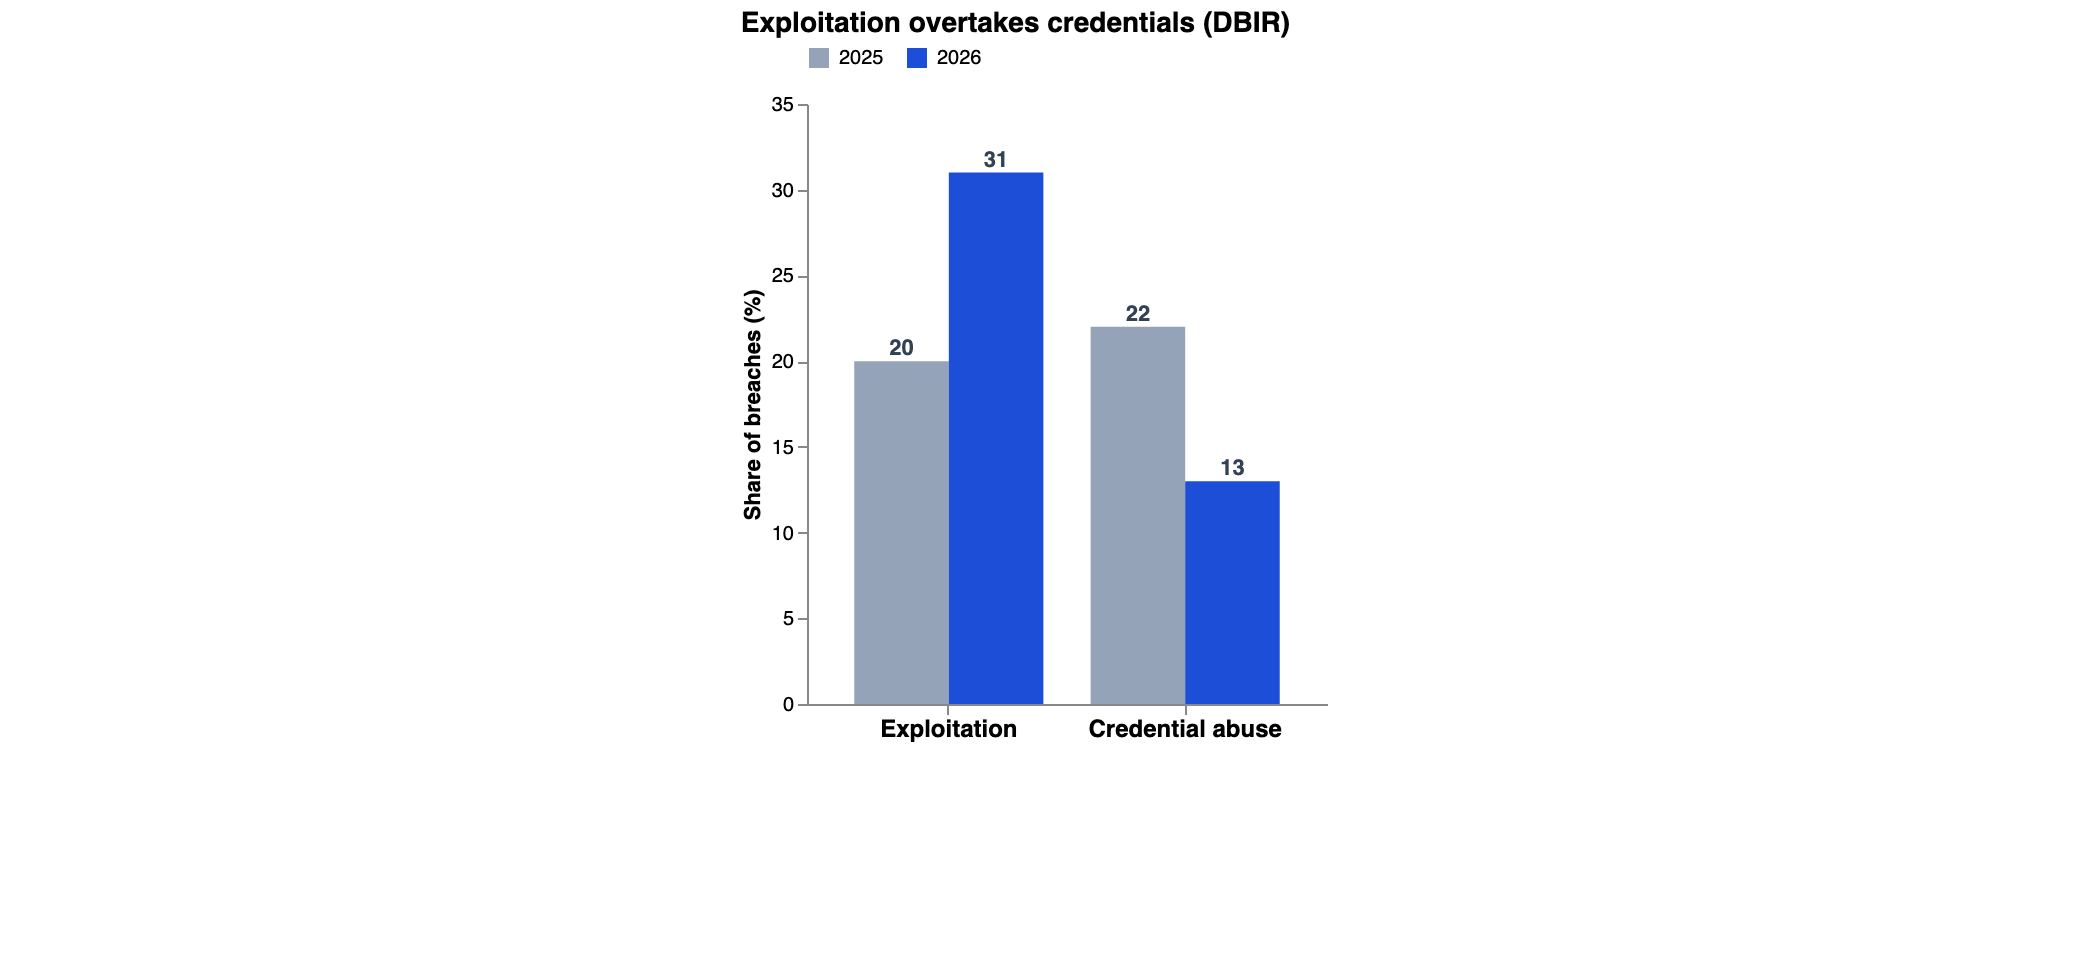
Static PNG — right-click to save, or <img src="https://security-resilience.ai/snapshots/dbir-crossover.png">.