Where LLM-driven code scanning earns its keep — and where it doesn’t
After running an LLM-driven code scanner across about a dozen repositories — a mix of API gateways, microservices, and shared libraries — three things have become clear. The scanner finds real vulnerabilities at scale. The bottleneck has stopped being discovery and started being remediation. And there’s a specific class of bug where the scanner still loses to a human reviewer: anything whose attack path crosses repository boundaries.
The setup
The scanner is an LLM-driven static analysis pipeline that runs as a GitHub Actions workflow, either on a monthly schedule or on demand. It produces JSON findings plus a GitHub Issue with each run; clean scans auto-close the issue. Output is reviewed by a security engineer before anything reaches the engineering tracking system. We’ve been operating it long enough that the operational pattern has stabilised, which is the point at which it’s worth writing down what we’ve learned.
Two operational rules shape the rest of the analysis. First, every finding the scanner returns carries a confidence score between 0.3 and 1.0, and only findings at confidence ≥ 0.9 are treated as actionable on a single-run basis. Lower-confidence findings still surface in the output, but they sit in an exploratory tier that requires human triage or multi-run corroboration before reaching the engineering backlog. Second, the analysis below focuses on critical and high severity findings — the tier where a single bug can meaningfully shift the security posture — with a small number of medium-severity findings included when they are the same canonical issue as a critical or high finding in another run (severity calibration drifts run to run; we include the medium-rated instances when other runs rate the same code higher). Lows and isolated mediums are excluded throughout, with a discussion of the broader scanner output below.
A representative scan illustrates the shape of what comes out. On parts of our code base in roughly that range of size, each scanner run returns 38–42 high-confidence high-or-critical findings, of which 10–15 are critical and the rest are high. Two-thirds of findings cluster into two domains: data-handling (logging hygiene, credential exposure, encryption misuse) and authentication / access control (broken session handling, IDOR patterns, weak token validation). The remaining third is split between configuration issues (proxy, database, ingress), input validation, and a handful of dependency-CVE findings. Business-logic flaws are essentially absent at this tier — one finding per run at most.
That is the high-severity subset. Beyond it, the scanner consistently surfaces another 100-or-so lower-severity findings per run — logging-hygiene weaknesses, defense-in-depth gaps, timing-side-channel patterns, configuration hardening opportunities — the kind of long tail that’s operationally useful but that would be prohibitively expensive to find by hand. A human reviewer doing this work at the same coverage would burn weeks per repository on findings that individually carry low blast radius but collectively raise the bar against a determined attacker. The scanner produces this long tail as a side effect of doing the critical work; the marginal cost is essentially zero. This article focuses on the critical-and-high tier because that’s where the methodology comparisons are sharpest, but it’s worth remembering that the scanner’s comprehensive coverage of the lower-severity tail is part of the cost-benefit story for adopting it.
Manual review of the highest-severity findings runs at better than 90% true positive rate. The scanner overstates severity on about a quarter of findings — the bug is real, but the blast radius is smaller than the scanner’s rating suggests. That number drives the operational reality: the LLM output goes to a security reviewer first, not directly into the engineering backlog.
Architecture
The pipeline has three phases. The design separates deterministic setup work, lightweight reconnaissance, and the deep vulnerability analysis that actually consumes the most capable model.
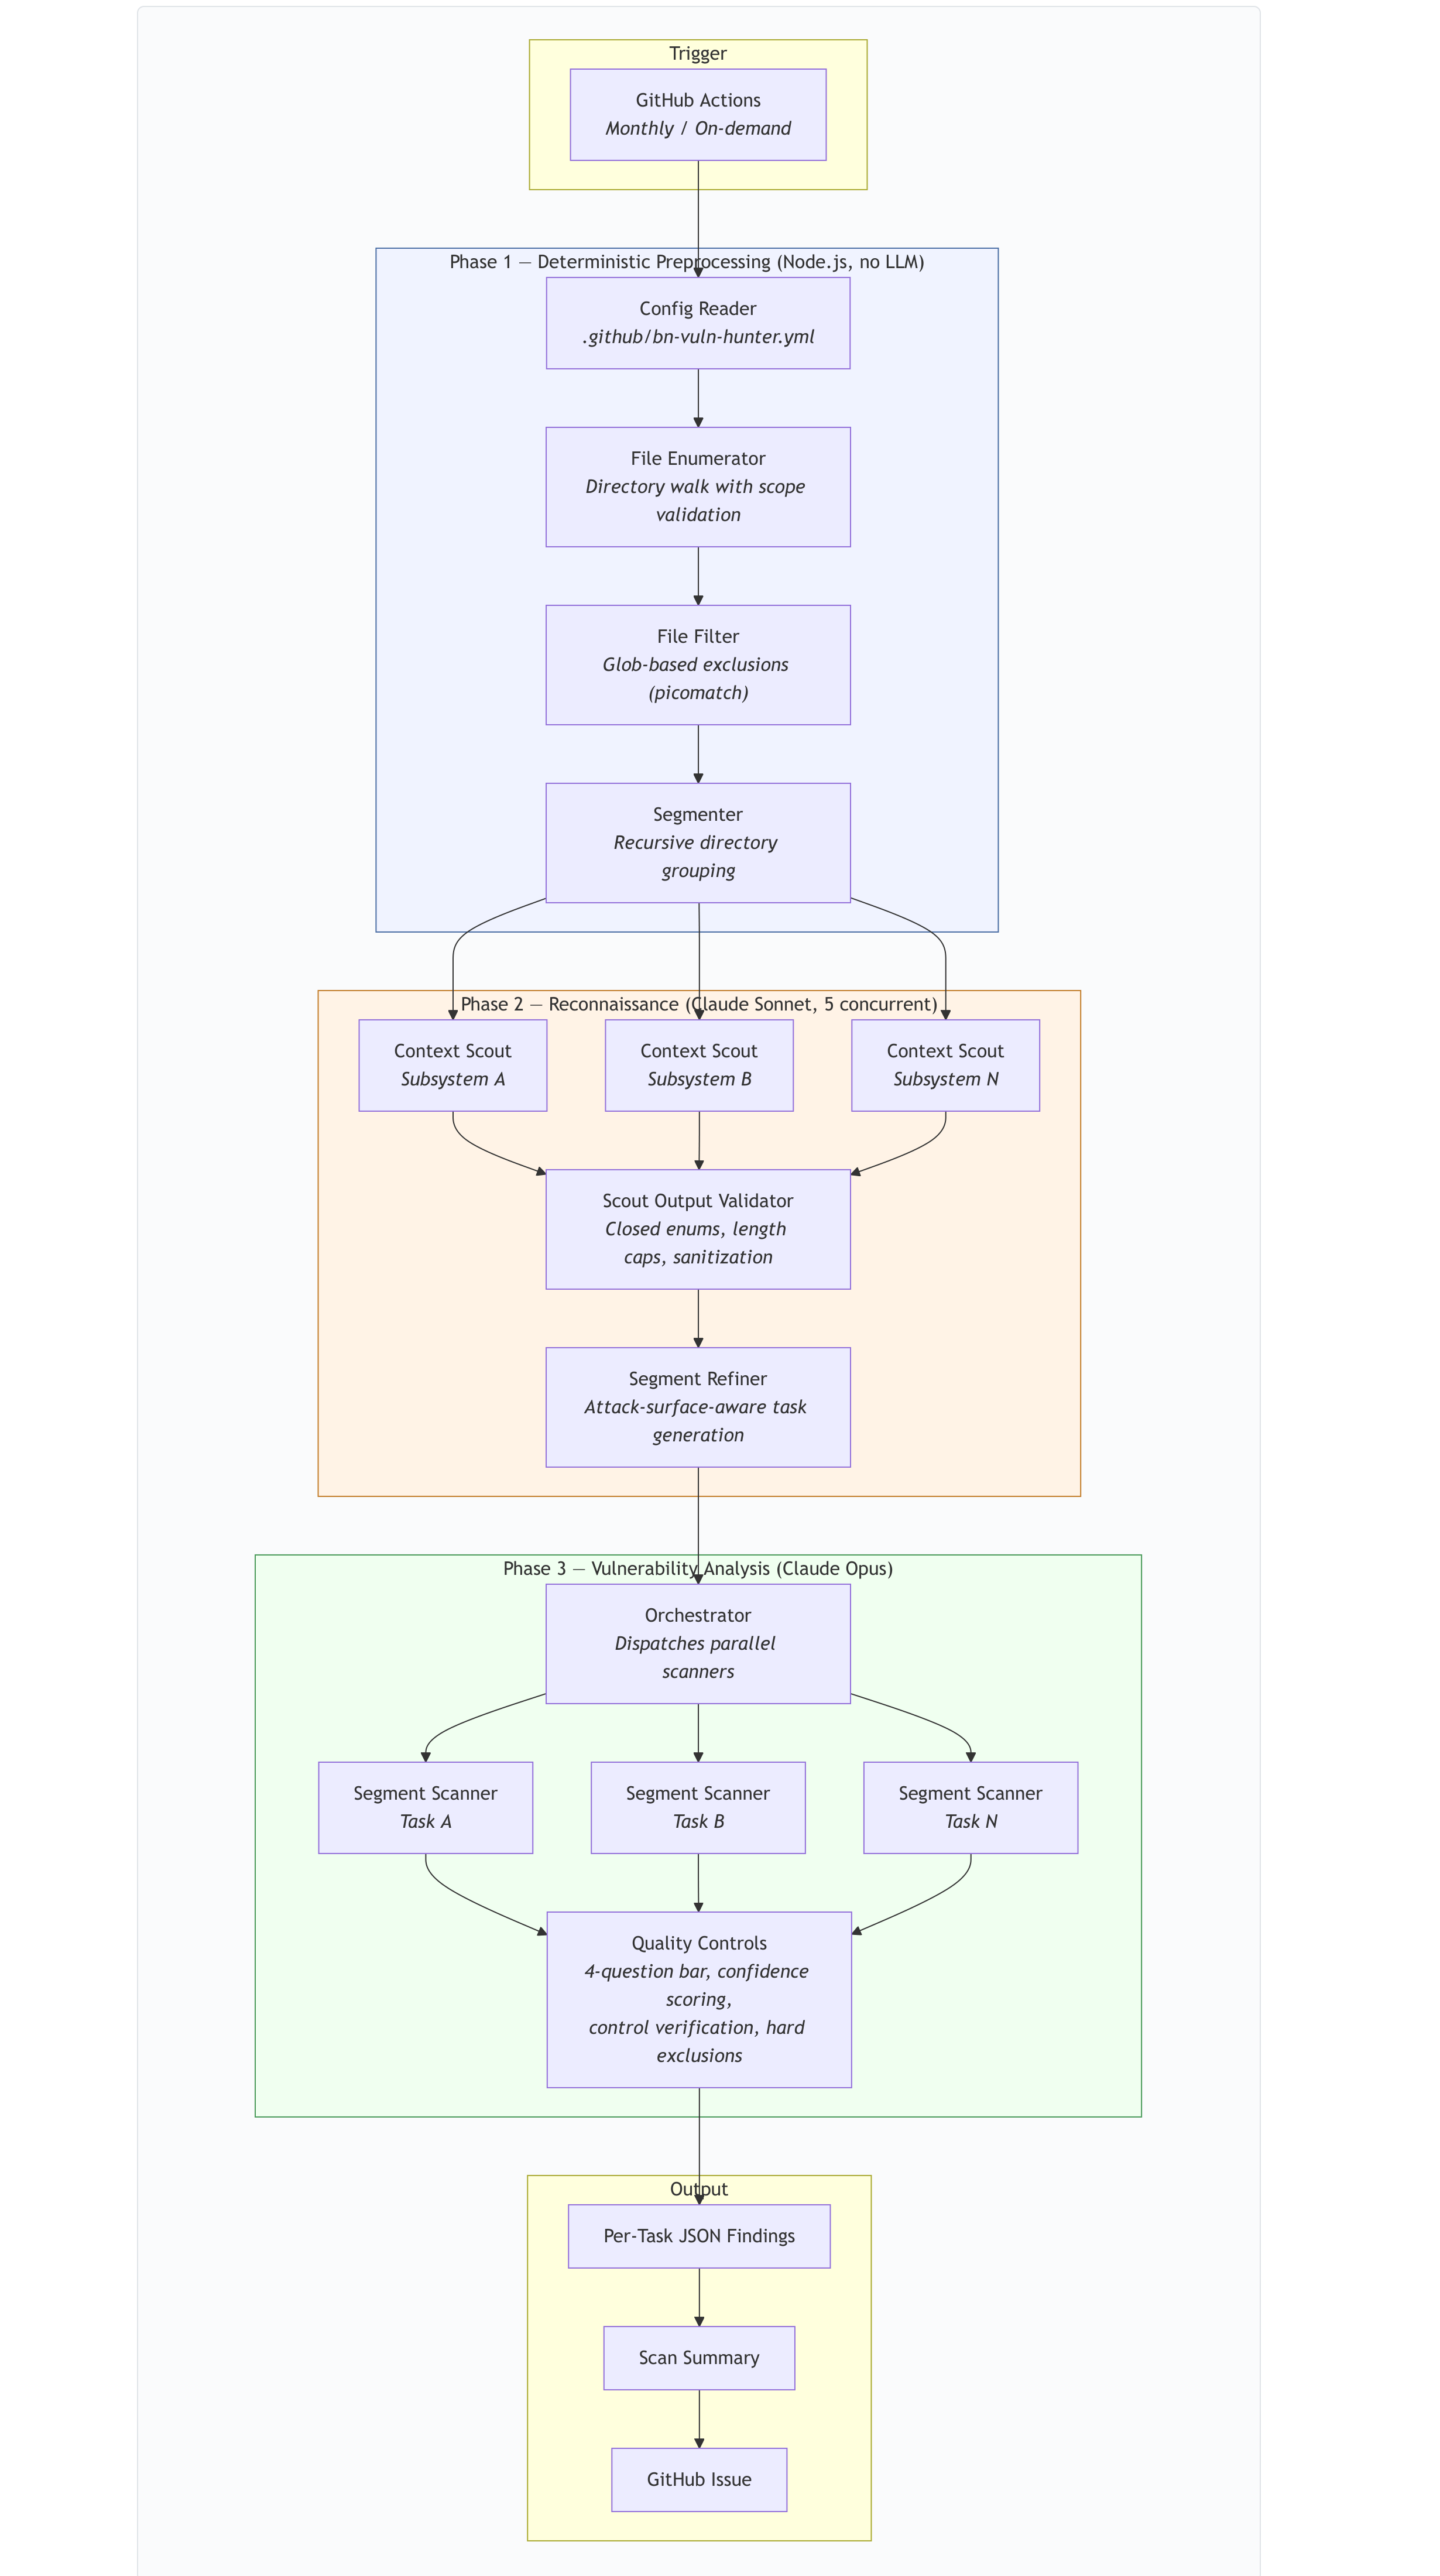
Phase 1 — Deterministic preprocessing. Pure Node.js, zero LLM calls. Reads the per-repository config, walks the scoped directories, applies glob-based exclusions (tests, docs, build artefacts), and groups files into coarse segments by directory hierarchy. Reproducible: identical inputs always produce identical segments. This used to be an LLM reasoning step; making it deterministic took non-determinism out of the pipeline and cut the per-run cost meaningfully.
Phase 2 — Reconnaissance. Up to five context scouts (running on Claude Sonnet) run in parallel, each reading ~15 wiring-and-registration files per subsystem and producing structured JSON: entry points, trust boundaries, attack surface categories, shared state, cross-cutting concerns. All scout output is validated against a closed schema before downstream use — required fields, length caps, depth caps, attack surface category mapped to a fixed enumeration. The scout pass lets the deep scanners start with a map of what to look for and where, instead of discovering the architecture during analysis.
Phase 3 — Vulnerability analysis. Segment scanners (Claude Opus) run in parallel, each one analysing files grouped by attack surface category rather than by directory. So auth-flow files are analysed together regardless of where they live in the repo; data-persistence files likewise. Each scanner reads its task context (file list plus scout output) and analyses in priority order: auth and authz first, then request handlers, then sinks (raw SQL, shell, file I/O, template rendering), then external integrations, then secrets handling. Scanners follow imports and call chains beyond their immediate file list when they need to verify a path.
One operational note: the pipeline itself is hardened against the codebases it scans. All scout and scanner prompts include explicit instructions to treat code as untrusted data, never as instructions. Scope path validation uses path-relativity checks, not prefix matching, to prevent sibling-prefix escapes. The CI job ignores the target repo’s agent settings to prevent the scanned codebase from influencing scanner behaviour. These defences sound paranoid until you remember the scanner reads attacker-controlled input by definition.
Four quality gates
Every finding has to pass four gates before it’s included in the output. These are what keep the signal-to-noise ratio livable:
- The four-question bar. A finding must answer: who is the attacker, what input do they control, how do they reach the vulnerable code, and what impact do they gain? If any question is unanswerable, the finding is dropped. This eliminates most of the noise that traditional SAST emits.
- Confidence scoring. Each finding is scored 0.3 to 1.0 against calibration anchors. A raw SQL interpolation pattern scores 0.95. A request body passed to a function whose query is not visible scores 0.65. A permissive CORS on a public read-only API scores 0.40. Anything below 0.3 is dropped automatically.
- Compensating control verification. Before a finding is reported, the scanner checks for auth middleware on the route, schema validation libraries (Joi, Zod, Pydantic) constraining the input, framework auto-escaping (React JSX, Django template), ORM parameterisation handling the query, or an allowlist constraining the value. If the control would block exploitation, the finding is dropped.
- Hard exclusions. Categories that produce more noise than signal are pre-filtered: denial of service, rate limiting, open redirects, memory safety in safe languages, anything in test or documentation files.
The combination is what lets the manual reviewer keep up. Without these gates, the LLM output would be unusable; with them, the reviewer’s job becomes severity calibration and attack-path verification rather than triage from scratch.
What it catches that traditional SAST misses
Static analysis tools find high volumes of low-value findings — the well-known precision problem. The LLM scanner’s value isn’t volume; it’s the kind of bug it can find. Three categories illustrate the gap:
Data-flow vulnerabilities that span configuration and
code. A canonical example: JWT algorithm confusion,
where code reads the algorithm name from an unverified token
header and passes it directly to the decoder. The decoder
accepts alg: none, and an attacker bypasses
authentication by submitting an unsigned token. Traditional SAST
looks for missing signature verification but does not trace the
data flow from the header value into the
algorithms parameter. The LLM does.
Semantic configuration analysis. An Envoy
proxy YAML config that disables external authorisation on an
/internal route prefix. The YAML is syntactically
valid; the bug requires understanding Envoy’s filter chain
semantics. SAST tools either don’t parse Envoy YAML or
check for syntax violations that don’t exist. The LLM
reasons about what the configuration actually does.
Multi-step reasoning across files and frameworks. A hash oracle where expected hash values are logged at ERROR level when URL verification fails. The vulnerability requires connecting three things: the log statement (intentional), the log destination (accessible), and the use of those hashes elsewhere (password reset tokens). Each step in isolation is innocuous. The LLM connects them. SAST doesn’t.
The scanner is also good at finding systemic patterns — the same class of bug appearing in many places. Twelve credential-logging sites across a single repository, four HTTP clients with TLS verification disabled, three subtly different JWT validation implementations across the same service. That’s the insight engineering teams find most actionable: not the individual finding, but the missing pattern it reveals.
Comparison with manual penetration testing
The same product was independently assessed by an external offensive security firm running a manual penetration test over three weeks. Their scope was wider than the scanner’s: multiple source repositories plus the production web applications that depend on them. The LLM scanner covered only parts of our code base — a subset of the manual scope. To make the comparison apples-to-apples, I’m restricting both sides to that shared subset.
Of the 16 findings in the manual report, 9 fall within the scanner’s scope at a severity worth comparing: 3 high-severity, 5 medium-severity, and 1 low-severity. (A second low-severity manual finding — non-constant-time comparison of security-sensitive values — is excluded from the count; the LLM did find the pattern at half a dozen sites but at low severity and confidence 0.4–0.8, which falls into the scanner’s broader output rather than the actionable tier. Both methods agreed it was low.) The scanner produced 38–42 high-confidence high-or-critical findings per run on the same scope; the meaningful head-to-head is on the high-severity tier.
Overlap: three direct matches, plus one chain
Under the high-confidence, high-severity filter, the LLM scanner and the manual reviewers independently identified the same underlying issue in three cases — and the LLM surfaced the component pieces of a fourth manual finding in different code, where remediating the LLM’s findings would close the manual finding as a side effect.
| Manual finding | Manual severity | LLM (≥0.9, critical+high) |
|---|---|---|
| Hardcoded credentials and keys in source | Medium | Direct: Critical / High in 3/3 runs (3–6 sites) |
| Unsalted MD5 password hashing | Medium | Direct: High in 3/3 runs (3–5 sites) |
| Outdated software dependencies | Medium | Direct: High in 2/3 runs (CVE bundle on a vulnerable proxy version) |
| Unauthorized cross-tenant redelivery (business-logic chain) | High | Component-level: IDOR-pattern findings at high+critical severity on adjacent endpoints; cross-tenant authorization weaknesses in the API-key layer |
Two things stand out about the three direct matches. First, the LLM scanner consistently rated shared findings more severely than the human reviewers did — the scanner’s severity calibration is hotter than a human’s, matching the operational observation that the scanner overstates severity on roughly a quarter of its findings. Second, where the manual report named one instance of a pattern, the LLM scanner found multiple sites of the same pattern in the same code.
The fourth case is the more interesting one and the reason
head-to-head counts undersell what the scanner actually
delivers. The manual reviewers found an exploitable business
logic chain — a low-privileged user could redeliver any
encrypted email cross-tenant by calling a message-log endpoint
that performed no authorization checks. The LLM did not flag
that specific endpoint, but it found the underlying pattern at
high severity in two adjacent forms: explicit IDOR findings on
another router family (a caller can pass an arbitrary
account_id and the endpoint doesn’t verify
ownership), and broader API-key authorization weaknesses
(wildcard cross-tenant CRUD on the API-key actor, sensitive
writes that accept the static shared key in lieu of JWT). An
engineering team that responded to the LLM’s findings by
adopting a tenant-scoped repository pattern and tightening the
API-key authorization model would close the message-log
endpoint as a side effect, even though the LLM never named it.
The scanner caught the shape of the bug; it just didn’t
compose the integrated business-logic exploit.
A similar — weaker — pattern holds for the manual’s second high-severity finding (arbitrary email spoofing through a deliver-new endpoint). The LLM flagged sender-policy wildcards, anti-spoof allow-list weaknesses, and client-controlled sender-policy timestamps in adjacent code, but at confidence 0.6–0.8 and mostly medium severity — below this article’s strict filter. The component-level remediation would help; under multi-run ensemble review these findings would graduate into the actionable tier.
Manual found, LLM missed
Of the 9 in-scope manual findings, the LLM did not match 4 — not even via component-level remediation chains. These are all bugs where the manual reviewers reasoned about business intent across endpoints or about subtle data exposure in otherwise reasonable APIs:
- Deleted users retain functional sessions and scopes (high). Account deletion did not invalidate active sessions, and the session-validation endpoint continued to issue new access tokens carrying the deleted user’s original scopes. Account deletion stopped working as an incident-response control. The LLM did not surface this gap at any confidence level. The session-invalidation lifecycle is a piece of business intent that doesn’t decompose cleanly into a code-level pattern.
- Incorrect authorization scope on the
account-settings update endpoint (medium). A
copy-paste error: the endpoint enforced
account:settings:readwhere every comparable write endpoint in the router enforcedaccount:settings:write. The LLM found other authorization weaknesses in the same file but did not catch this single-token-difference bug. Single-token defects in otherwise-well-formed routers are hard to spot without cross-endpoint comparison. - Temporary passcode not invalidated after use (medium). The passcode-validation flow checked the passcode against Redis but never deleted it, allowing unlimited replay within the 15-minute TTL. A comparable passcode-validation flow in the same codebase did invalidate after use. The LLM found a different, more severe bug at the same endpoint (the endpoint was also unauthenticated) but missed the invalidation gap. This bug requires reasoning about “these two flows should behave the same, but don’t.”
- Password hashes queryable via user-settings API
(low). A user-settings endpoint accepted a
namequery parameter with no allowlist; supplying?name=passwordreturned the stored MD5 hash. The LLM flagged the underlying weak-hash issue prominently but did not flag the API endpoint as an exposure surface. The bug requires reasoning about what data shouldn’t leak through an otherwise reasonable introspection API.
The pattern is consistent: every one of these is a business-intent or cross-endpoint-comparison reasoning task, not a single-call-site pattern match. That’s the methodology gap.
LLM found, manual missed: infrastructure and configuration
Conversely, the LLM scanner’s rock-solid core — the 11 critical findings that appear at confidence ≥ 0.9 in every run — includes several that the manual report does not mention. The notable ones:
- Envoy external authorisation disabled on
/internalroutes (three separate configuration files: production, development, and the Helm chart template) - Envoy admin API bound to 0.0.0.0:8001 with no authentication (same three configurations)
- MySQL initialisation script granting
ALL
        PRIVILEGES
to a passwordless superuser from any host
None of these appear in the manual report. They are infrastructure and configuration findings — YAML and SQL — that a code-and-running-app penetration test does not always surface, even when the source repository is in scope. Beyond the rock-solid core, the LLM scanner’s broader output includes dozens more high-severity findings the manual report didn’t enumerate: credential-logging sites at scale, TLS-verification-disabled HTTP clients, IDOR patterns in router endpoints, ingress catch-all rules.
The pattern is sharp
| Capability | LLM scanner | Human pen tester |
|---|---|---|
| Coverage | Exhaustive (every file) | Focused (high-value targets) |
| Consistency | Same patterns every run | Varies by tester |
| Speed | Hours | Weeks |
| Infrastructure / configuration breadth | Excellent | Inconsistent |
| Crypto and authentication misconfiguration | Excellent | Good |
| Business-logic flaws | Limited | Excellent |
| Authorization logic across endpoints | Limited | Excellent |
| Session-lifecycle reasoning | Limited | Excellent |
Tallying the head-to-head: of the 9 in-scope manual findings, the LLM scanner matched 4 at the article’s strict filter — 3 directly and 1 via component-level coverage that would close the manual finding through systematic remediation. A fifth (email spoofing) matched in the scanner’s broader output below the filter. The remaining 4 the scanner missed entirely, including the cross-tenant redelivery’s sibling finding on session invalidation and three smaller bugs where the manual reviewers reasoned about business intent across endpoints. Conversely, the scanner’s 38–42 high-confidence findings per run surfaced multiple critical infrastructure and configuration bugs the manual reviewers did not enumerate. Where they overlapped on direct matches, the scanner rated severity higher than the humans did. And beyond that high-severity comparison, the scanner’s broader output covers a long tail of lower-severity issues at a scale humans simply can’t justify the cost of reviewing.
Comparison with rule-based SAST
We also ran the scanner side-by-side with a commercial rule-based SAST tool on a single representative PHP/Symfony repository — the same codebase scanned end-to-end by both engines, with overlap and class coverage mapped by hand. A few observations from that exercise are more useful than the count comparison most write-ups lead with.
Counting findings is the wrong axis. Two
scanners can disagree by an order of magnitude on total volume
and still tell a consistent story about the codebase —
they’re summarising at different levels of resolution.
What actually distinguishes them is the breadth of vulnerability
classes each one covers and the actionability of the individual
findings it produces. The rule-based engine excelled at
well-defined syntactic patterns — TLS verification
disabled, raw $_REQUEST concatenation in known sink
positions, deserialization of attacker-controlled input. The
scanner covered roughly twice as many distinct classes, including
categories the rule-based engine has no rules for at all:
business-logic authorization, IDOR, session lifecycle, hardcoded
credentials, cross-component data flow. Reporting “we
found more findings” obscures that asymmetry. Reporting
which classes each tool covers does not.
Confidence scoring is the under-discussed feature. Per-finding confidence is the single mechanism that makes large-output LLM scanning operationally usable. The rule-based engine emits findings with no confidence dimension — every result is either present or absent, and the consumer is left to triage the entire list. The scanner attaches a 0-to-1 confidence score per finding, and that one number partitions the output into a high-confidence band that goes straight to a fix queue and a lower-confidence tail that goes to human review. Anyone building a similar tool should ship confidence as a first-class field on every finding, not as an internal heuristic the reviewer can’t see.
Methodology lessons for anyone running this comparison. Two practices made the exercise honest enough to learn from. First, adjust for shared scope before computing overlap rates — runtime-budget exclusions on either side will distort the headline number, and in our case a meaningful share of the rule-based findings sat in directories the scanner had been configured to skip for performance. The exclusion list is itself a security decision and deserves the same periodic review the scanner version gets. Second, walk every apparent “miss” by hand. In our pairing the rule-based scanner flagged a syntactic pattern in voter classes — functions that never returned a negative authorization decision — and the scanner reported different, deeper issues in the same files: IDOR, URI-substring bypass, missing ownership checks. Counted naively as misses, those rows penalise the scanner for producing more useful output. Counted on the right primitive — “same file, deeper issue” — they’re a feature, not a gap. Either tool used alone leaves visible blind spots; class-level comparison tells you where to bring in the other.
Future direction: feeding the engines into each other. The most interesting unexplored move is to use the two systems as inputs to each other rather than independent reports. Feed rule-based findings into the LLM scanner as context — “the pattern engine flagged this voter as syntactically suspect; investigate whether there is a deeper authorization issue at this site” — and the model gets a curated set of priors that lift the precision of its analysis. Run the reverse where it’s tractable: when an LLM finding describes a regex-checkable pattern, materialise it as a rule the pattern engine can re-run on every commit. Both directions narrow the gap each tool leaves on its own without forcing the consumer to choose between paradigms.
How reproducible are these scans?
An obvious question for LLM-driven analysis: how much does the output vary run to run? We re-scanned the same scope three times against the same commit, hours and days apart, with identical configuration. Total findings came back at 190, 202, and 164 — about a 15% spread around the mean. Within that, the critical-and-high band landed at 72, 73, and 56.
Naive matching on the raw record ID overstates the noise, because the scanner phrases the same issue differently each run. The JWT algorithm-confusion finding appears across all three runs as “alg taken from unverified header,” “attacker-controlled `alg` from token header,” and “attacker-controlled alg passed to decoder” — same code, same line, three wordings. To match findings across runs we cluster on three signals together: the file path, the security domain, and overlapping line ranges. Two findings in different runs are the same canonical issue if their reported line ranges intersect, even if the titles and descriptions don’t match verbatim. This catches both the reworded-title case and the case where one run splits a finding into two reports while another reports it as one.
Take the subset of findings that hit the highest quality bar — rated critical severity AND with confidence above 0.9 — in any of the three runs. There are 15 such canonical issues across the dataset. Eleven of them — 73% — are found in all three runs. The remaining four are found in two of the three runs. None are invisible to more than one run. If a finding clears the highest bar once, it almost always surfaces again on the next two scans, even if the second scan describes it slightly differently or assigns it a slightly different severity.
The named issues in that core are textbook bugs: unsalted MD5 password hashing, an unauthenticated passcode endpoint, Envoy external authorisation disabled on internal routes (across three separate configurations), the Envoy admin API bound to 0.0.0.0:8001 with no auth, a MySQL grant of full privileges with no password, and JWT signing keys plus AES encryption keys committed to a config file. Each is exactly the kind of finding a scanner exists to surface.
The detail also exposes what severity drift looks like in
practice. The MD5 hashing finding is rated high in run
3, critical in run 4, high again in run 5
— confidence ~0.95 every time. The Envoy ext_authz
config is critical / critical / high.
The scanner is rating the same finding differently across runs
at the high/critical boundary. The bug is real and the
confidence is high; it’s the severity label that
wobbles. Reviewers calibrate this on the way to the engineering
backlog.
Reproducibility weakens as the bar drops. Across the full 322 canonical issues at any severity, only 22% appear in all three runs and 58% appear in only one. The dominant domains (data-handling, auth and access control) reproduce closely across runs in both count and content; business-logic findings — already the smallest slice — are the least stable. The scanner’s own confidence score is the cleanest single predictor of recurrence: at cluster-max confidence ≥ 0.9, 49% of issues appear in all three runs and only 18% are one-shot; at confidence below 0.5, no issues appear in all three runs and 95% are one-shot. Confidence is doing what it should.
For practical purposes this means: trust the high-confidence core on a single run; treat the medium-confidence band as candidates for ensemble review (run more than once, union the output); and treat low-confidence findings as starting points, not conclusions. Reproducibility is strong at the top and gets noisier as you walk down the severity ladder — which makes the next observation more, not less, significant.
The bottleneck has shifted to remediation
The interesting observation, after a dozen scans, isn’t about the scanner. It’s about what the scanner exposes next.
Each scan reproducibly finds 38–42 high-confidence critical-and-high findings per repository, ninety-plus percent of which hold up under manual review — plus a longer tail of lower-severity findings that engineering teams pull from when the urgent work is done. Engineering teams can fix individual findings quickly — one-line patches, a parameterised query, a config flip. But many of the highest-value findings aren’t one-liners. They’re symptoms of a missing pattern, and the right fix isn’t to patch each site; it’s to introduce the pattern and migrate every site to it.
The canonical example is broken access control with missing tenant scoping — the OWASP A01 category and the dominant source of IDOR vulnerabilities in any multi-tenant service. A scanner finds ten endpoints returning resources without verifying the actor owns them. The naive fix is ten checks, one per endpoint:
def get_report(report_id, actor):
    report = repo.get(report_id)
    if report.account_id != actor.account_id:
        raise HTTPException(403)
    return report
That works, until the next scan finds five more endpoints that grew the same shape in the meantime. The architectural fix is a tenant-scoped repository pattern that performs the ownership check automatically, and migrating every data access site to use it. That’s a multi-sprint, multi-team effort: design the pattern, refactor the call sites, update tests, stage the rollout, and prevent regression with a CI check. It easily takes two to three months across owning teams, even with engineering capacity allocated.
The same shape applies to the other recurring categories the scanner exposes:
- Credential-logging at scale. The per-call-site fix is one line. The architectural fix is a centralised log sanitiser applied to every logger invocation across services. Building and adopting the sanitiser, then deprecating direct logger calls, takes weeks.
- JWT validation harmonisation. The per-service fix is an explicit algorithm allowlist plus audience and issuer validation. The architectural fix is a shared validation library and a migration plan across every service that issues or accepts tokens. Cross-team coordination tax.
- TLS verification across HTTP clients.
Per-site fix: remove
ssl=False. Architectural fix: a secure-by-default HTTP client factory used everywhere, plus a lint rule against the unsafe form.
The pattern is consistent: the scanner finds in hours what takes engineering quarters to remediate properly. As reproducibility of scanning improves, the discovery-side delay collapses to zero, and the constraint becomes engineering capacity to adopt the right patterns. For security leadership that’s a meaningful resource-planning shift — less tool spend, more engineering coordination.
Where it still loses: chains that cross repository boundaries
The scanner reads one repository at a time. It traces imports and call chains within that repository, follows attack-surface-to-sink paths, and recognises framework patterns. But it does not have a global service map. Vulnerabilities whose attack path crosses repository boundaries are systematically under-found.
Examples of such vulnerabilities could be:
- Split-trust SSRF. Repository A validates a URL against a regex before passing it across a queue or HTTP call. Repository B receives the URL and performs the actual outbound fetch, assuming validation already happened. A scanner reading either repo in isolation sees benign code; the chain that violates the trust boundary is invisible.
- Trust-fanout on authentication assertions.
Repository A validates a JWT (correct audience, valid
signature) and passes a derived
X-User-Idheader to repository B. Repository B trusts the header. If repository A is ever exposed without its validator (for example a debug endpoint, a misconfigured ingress, or a regression), repository B’s identity assumption is violated, but neither repo’s scanner can see the coupling. - Webhook signature reuse. Repository A signs outbound events with a shared secret; repository B verifies inbound events from the same provider. If the secret leaks anywhere in either repository (logs, config dump, recovered build artefact), both ends are compromised. The secret-handling scanner finds the leak; the chain-of-trust consequence is not visible.
These are the bugs human pen testers still find that the scanner doesn’t. The fix is architectural — a service-map-aware scanning layer that traces calls across repos — and it’s a non-trivial extension. Until then, the partition between “LLM scanner finds” and “human pen tester finds” is genuine, not ideological.
What this means for security leadership
Putting the three observations together, the practical implications for a CISO running this kind of pipeline are narrower than the marketing would have you believe but more consequential than the hype-fatigue reaction suggests.
Five practical takeaways
- LLM code scanning is real, not a demo. The findings are mostly true positives at high confidence, the categories it catches are categories that SAST misses, and the precision is high enough that a single human reviewer can keep up with the output.
- It does not replace manual pentesting. The scanner matched 4 of 9 in-scope manual findings on the same code base (3 directly, 1 via a component-level IDOR-pattern chain that would close the manual finding through systematic remediation). The 4 it missed are business-intent and cross-endpoint-comparison bugs — session-invalidation on user delete, copy-paste scope mismatches, passcode-invalidation gaps, sensitive data leaking through reasonable-looking introspection APIs. Meanwhile the scanner surfaced infrastructure and configuration criticals the manual report didn’t enumerate. Plan to use both.
- Severity calibration is the human’s job. The scanner’s severity ratings run hotter than a human’s — about a quarter of findings are real but smaller-blast-radius than the scanner says. Plan for security review before findings hit the engineering backlog.
- Plan for the remediation crunch. Discovery is no longer the constraint. Engineering capacity to adopt secure-by-default patterns and migrate every call site is. Budget for that, not just for the tool.
- Direct manual review at application-layer logic. Authorization rules across endpoints, session and credential lifecycles, cross-tenant data flows, and multi-repository attack chains are where the scanner has consistent blind spots and where humans still earn their fees. Don’t spend pen-test hours on coverage the scanner already provides.
A methodology-stumble worth naming
Honest disclosure: in parallel with this work I’ve been running a separate LLM-author pipeline that builds cross-walks between security frameworks (the chips you see on this site). A careful reading uncovered that early in that project two different conventions for what “A→B = partial” meant had crept into different author scripts — some treated it as “A partially covers B” (the intuitive math reading), others as “B partially covers A.” The LLM was internally consistent within each author run, so every individual pair was self-consistent; but reading across pairs and across articles gave inconsistent results until I audited every framework pair, picked one convention site-wide, and migrated the affected stored rows. It’s a small reminder that ambient LLM tooling needs the same kind of careful prompt-and-schema engineering that other software does — the failure mode is silent inconsistency rather than a visible error. The methodology piece has the detail; I mention it here because it’s the same shape of problem the scanner work surfaces in code: every plausible output deserves verification, especially when the convention anchors are subtle.
Cartography again
The scanner is a map, and a surprisingly good one. It tells you where the well-defined bug shapes live, which call sites need attention, and which patterns are missing across the codebase. It does not walk the territory for you, and it does not see the bridges between regions. Knowing which work the map can do and which work it can’t is most of the operational learning. The rest is engineering capacity.
Credits
The scanner, pipeline hardening, and operational learning that this article describes are the work of many hands. Thanks in particular to Daniel Cook, John D’Orto, Tim Frye, Gayathri Krishnan, Wes Leach, Matt Levac, Tyler Long, Ryan Miguel, Paul Roycroft, Alejandro Salinas, and George Tibu.
Generated 02 June 2026 14:43 UTC .