Vulnerabilities in Security Software
Last updated: 09 Jun 2026 04:44 UTC
Security software runs with privilege, on the perimeter, and on every endpoint. When it has a bug, that bug inherits the privilege, the perimeter, and the endpoint. In a companion piece we examined CVEs in AI software; this article examines the much larger corpus of CVEs in security software itself — firewalls, EDR, SIEM, IAM, vuln scanners, ZTNA gateways — and asks whether the products meant to defend hold up better, worse, or about the same as the systems they are meant to protect.
Scope and data
We split the question into two parallel tracks. Track A covers pure-play security vendors — companies whose primary business is security tooling. Track B covers the security sub-products inside generalist vendors: Microsoft Defender / Entra / Sentinel, Google Chronicle and Safe Browsing, Apple XProtect, AWS GuardDuty and Macie. The non-security baseline is everything else.
| Security category | Track A examples (pure-play) | Track B examples (generalist sub-product) |
|---|---|---|
| Firewall / VPN / NGFW | Cisco, Palo Alto, Fortinet, Juniper, F5, Citrix, SonicWall, Barracuda, Ivanti | — |
| EDR / AV / endpoint protection | CrowdStrike, SentinelOne, Sophos, Trellix, Trend Micro, Symantec, Bitdefender, Kaspersky | Microsoft Defender, Apple XProtect |
| SIEM / SOAR / log mgmt | Splunk, Elastic, Graylog | Google Chronicle, IBM QRadar, Microsoft Sentinel |
| Vulnerability management | Tenable, Qualys, Rapid7, Greenbone | — |
| IAM / PAM / SSO | Okta, Ping, Auth0, Yubico, Duo, CyberArk, BeyondTrust, Delinea | Microsoft Entra, Azure Active Directory |
| WAF / CDN / DDoS | Akamai, Cloudflare, Imperva, Fastly | AWS WAF / Shield |
| ZTNA / secure gateway | Zscaler, Netskope, Tailscale, Twingate | Google BeyondCorp |
| Cloud security | — | AWS GuardDuty / Macie / Security Hub / Inspector |
Data: NVD (National Vulnerability Database) for CVE records, EPSS for near-term exploitation probability, CISA KEV for confirmed in-the-wild exploitation. Window: CVEs published between 1 January 2025 and the last complete month of 2026. Open-source security tooling (Suricata, Zeek, Snort) and ICS-specific security products (Siemens automation, Rockwell PSIRT advisories) are out of scope for this analysis.
Summary findings
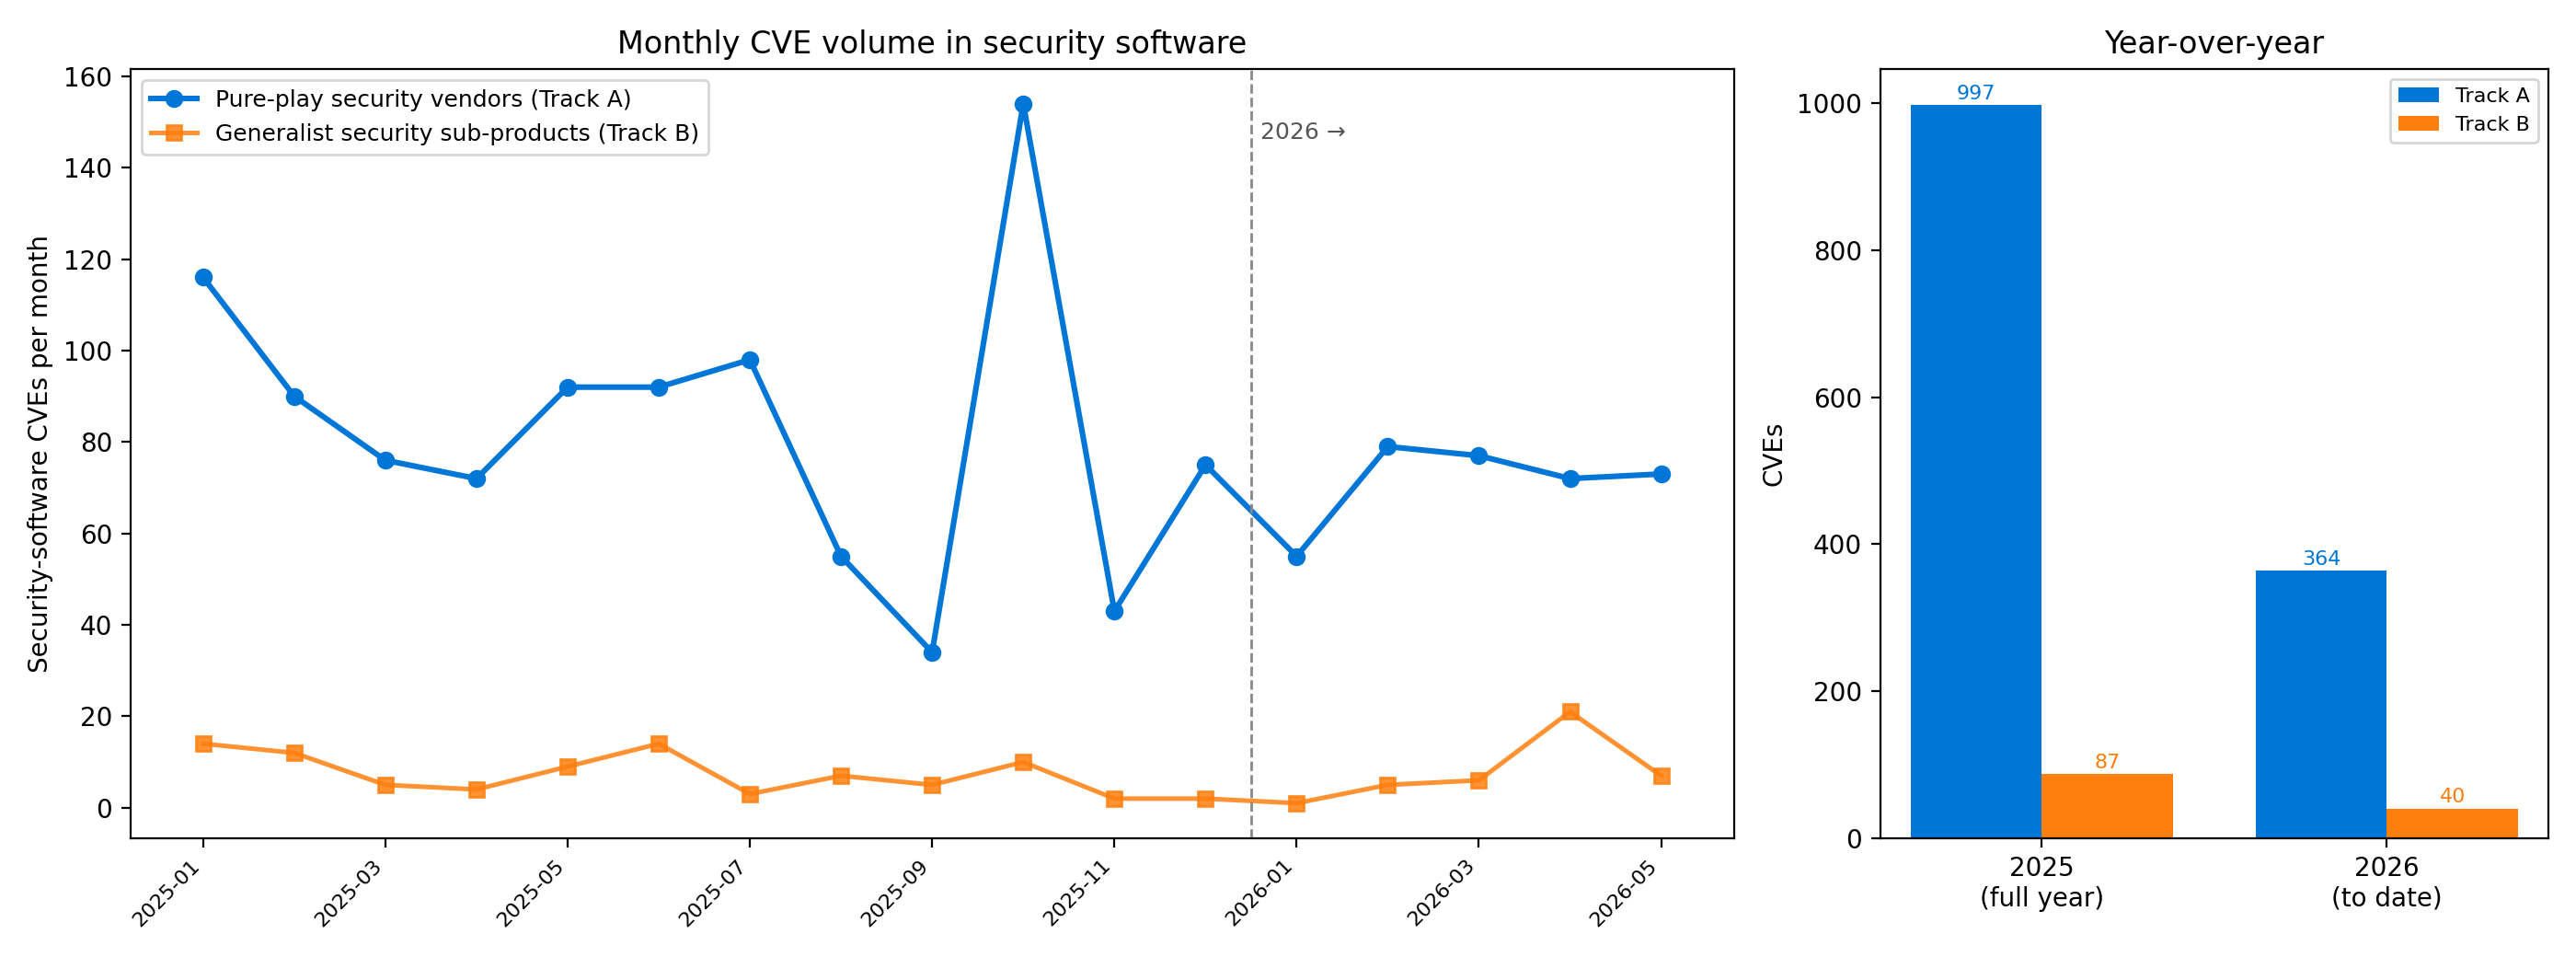
- Volume is large. Track A produced 997 CVEs in 2025 and another 364 through the last complete month of 2026; Track B added 87 and 40. Pure-play security software publishes CVEs at roughly an order of magnitude more than the security sub-products of generalist vendors.
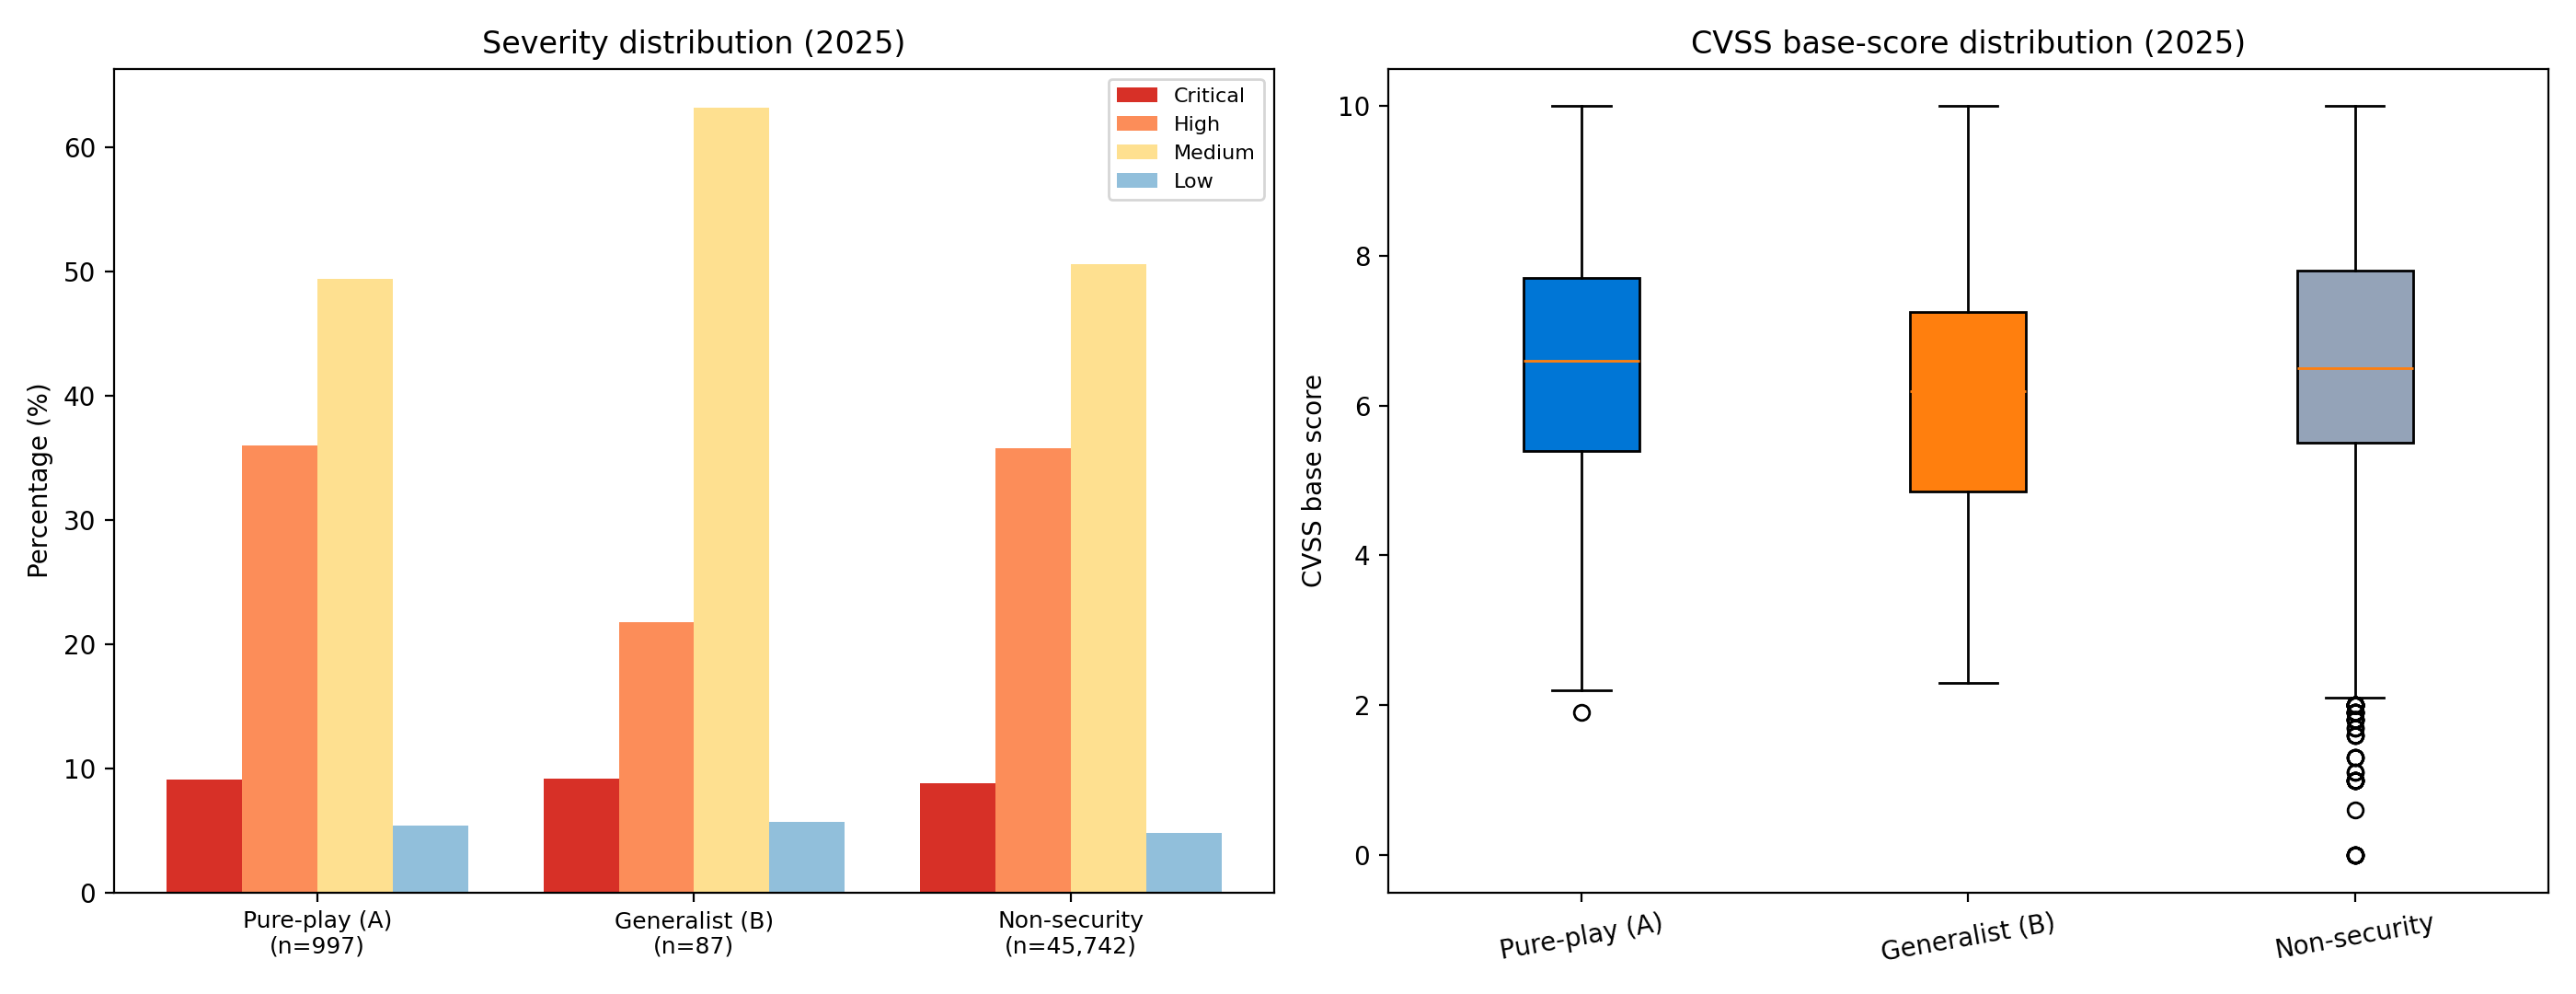
- Severity is high but no higher than the baseline. Average CVSS base score is 6.65 for Track A and 6.18 for Track B, against 6.62 for the non-security baseline. By Critical-or-High share the gap is small in either direction.
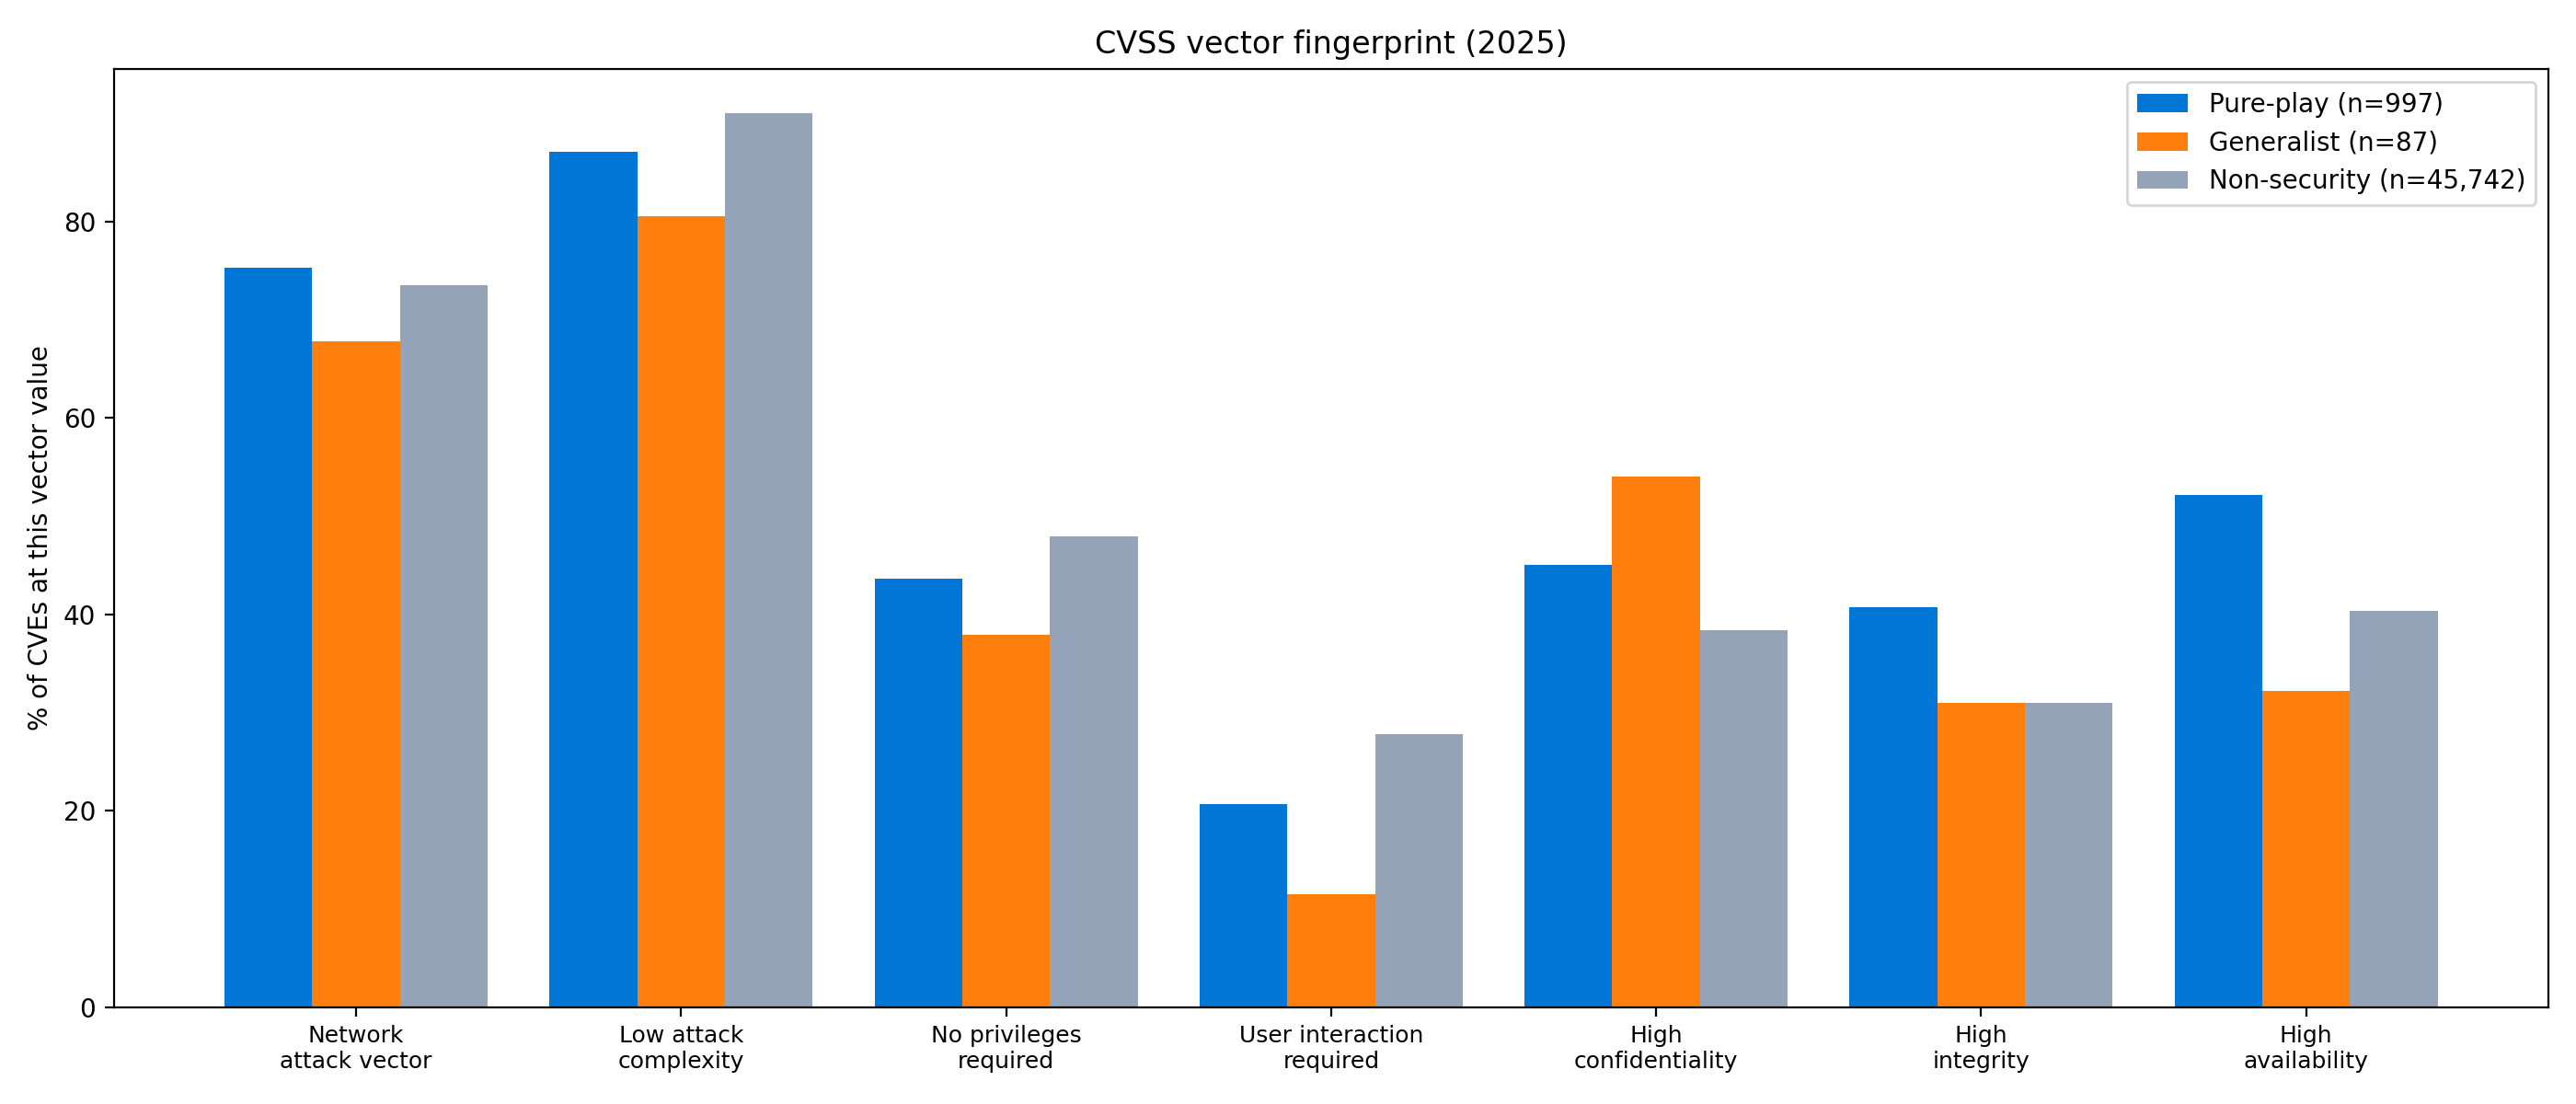
- Where they differ is impact, not headline severity. Track A CVEs are slightly more network-reachable (75.3% vs. 73.5% for the non-security baseline) and carry higher confidentiality impact when exploited (45.0% high-C vs. 38.4%). Privilege and complexity components are similar to the baseline.
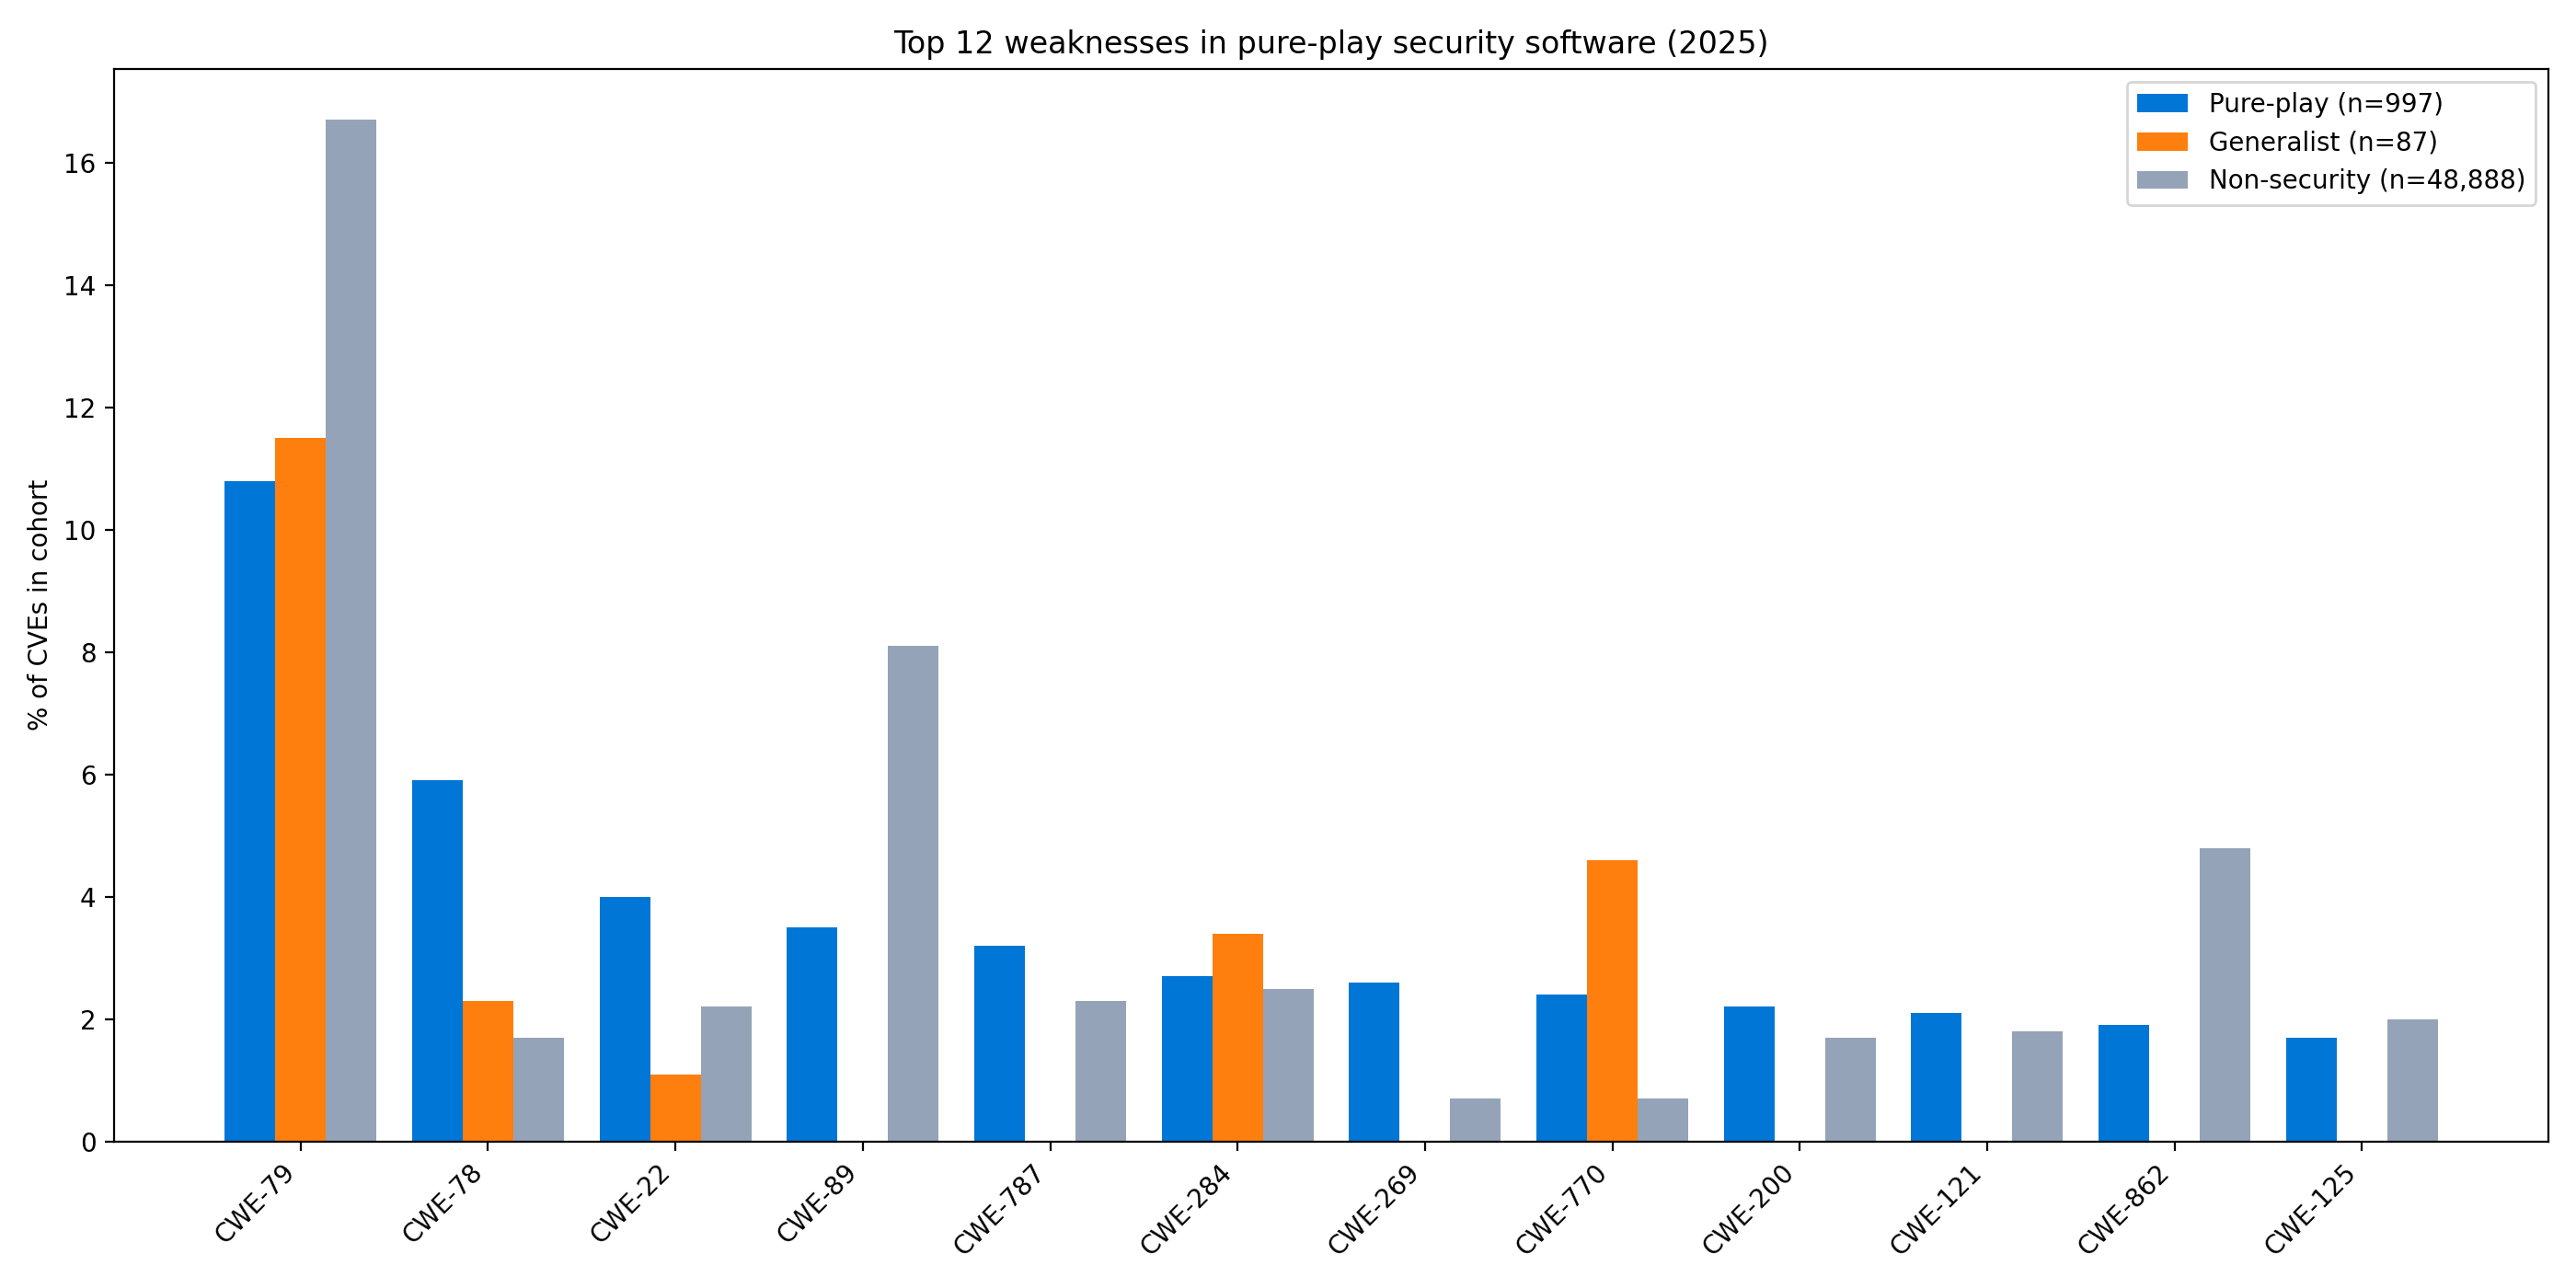
- Top weaknesses in Track A: CWE-79 (10.8%), CWE-78 (5.9%), CWE-22 (4.0%), CWE-89 (3.5%), CWE-787 (3.2%). The profile is dominated by injection, authorization, and path-traversal bugs in management interfaces — not memory-safety. Track B flips this: the Microsoft and Apple security sub-products carry memory-safety bugs (CWE-416, CWE-787) at the top of their list.
- Real-world exploitation is unevenly distributed. ZTNA gateways, IAM/PAM products, and edge firewalls land on CISA KEV at rates that materially exceed their share of CVE volume. EDR/AV and SIEM are largely absent from KEV in the window.
- EPSS-near-term-exploitation risk runs higher for Track A (4.51% of CVEs above 0.1) than for the non-security baseline (1.6%).
- Acquisitions are hard to read in this dataset. Of the deals we'd most want to examine — Splunk → Cisco, Symantec → Broadcom, FireEye/Mandiant → Google, Carbon Black → VMware → Broadcom — only the VMware → Broadcom deal is partly observable in the window, and even there we lack a pre-acquisition baseline.
The security-software attack surface is large
Pure-play security vendors are responsible for a meaningful share of the modern CVE corpus. Track A produced 997 CVEs in 2025 and already 364 through the last complete month of 2026 — a year that is on pace to substantially exceed the prior year on volume alone. Track B, the security sub-products inside generalist vendors, is an order of magnitude smaller: 87 CVEs in 2025 and 40 so far in 2026.
The gap between the two tracks is mostly a reporting artefact: Microsoft, Google and Apple publish security sub-product CVEs into their broader vendor stream rather than tagging them as Defender-specific or Chronicle-specific. The pure-play stream is more visible because the whole vendor exists to make security tooling. Both streams matter; they surface in different operational contexts.
Severity
By raw CVSS the two security tracks look ordinary. Average base score is 6.65 for pure-play, 6.18 for generalist sub-products, 6.62 for the non-security baseline. Roughly 45.1% of Track A CVEs and 31.0% of Track B CVEs are High or Critical, versus 44.6% for the baseline.
This is the first counter-intuitive finding of the article: by the single-number CVSS yardstick, vulnerabilities in security software do not look more severe than vulnerabilities in everything else. The damage they cause depends on which CVSS components are elevated, not on the headline number.
The CVSS fingerprint
Decomposing the CVSS vector shows where Track A leans. Pure-play security software is mildly more network-reachable (75.3% of CVEs vs. 73.5% for non-security software) and — the more interesting bias — carries higher confidentiality impact when exploited (45.0% high-C versus 38.4% for the baseline). Privilege requirements and attack complexity look broadly similar to the non-security corpus. A management web UI on a firewall, a SIEM ingest port, or an IAM admin endpoint is, almost by definition, an internet-reachable surface that brokers sensitive secrets when exploited; the data reflects that asymmetry.
Which categories are riskiest?
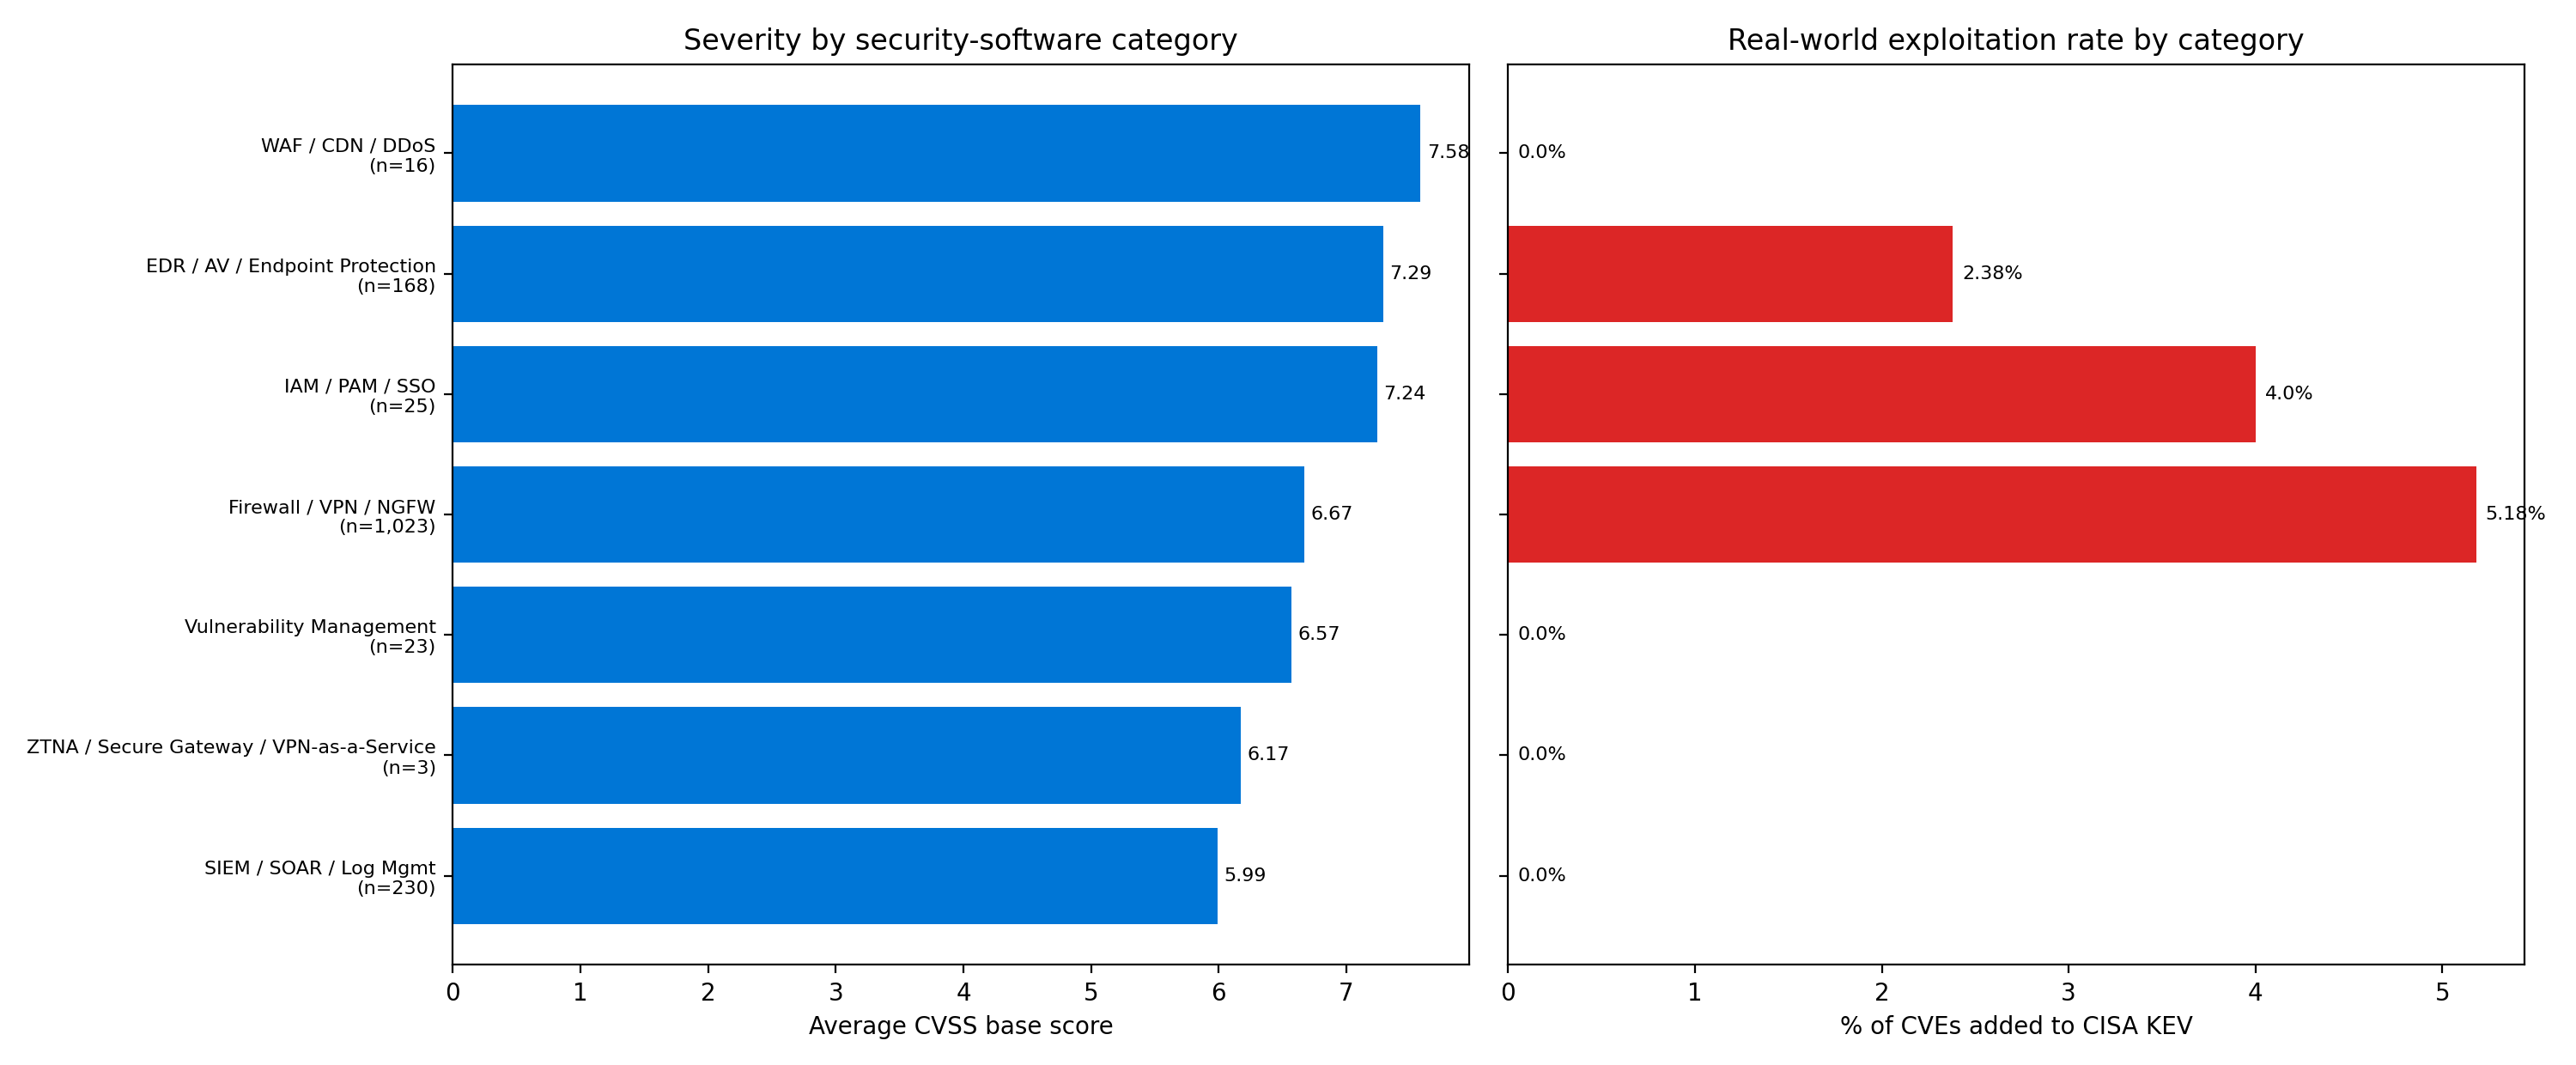
Splitting Track A into security-software categories reveals a clear hierarchy of operational risk:
| Security category | CVEs (24mo) | Avg CVSS | % in KEV |
|---|---|---|---|
| WAF / CDN / DDoS | 16 | 7.58 | 0.0% |
| EDR / AV / Endpoint Protection | 168 | 7.29 | 2.38% |
| IAM / PAM / SSO | 25 | 7.24 | 4.0% |
| Firewall / VPN / NGFW | 1,023 | 6.67 | 5.18% |
| Vulnerability Management | 23 | 6.57 | 0.0% |
| ZTNA / Secure Gateway / VPN-as-a-Service | 3 | 6.17 | 0.0% |
| SIEM / SOAR / Log Mgmt | 230 | 5.99 | 0.0% |
Note: the ZTNA / Secure Gateway row rests on only 3 CVEs and WAF / CDN / DDoS on 16, so their averages and KEV rates are unstable — a single CVE would move them materially. Read the small-denominator rows as directional, not precise.
The KEV-rate column is the column that matters. Average CVSS is broadly similar across categories, but the proportion that ends up on CISA KEV — i.e. that gets exploited in the wild — varies by an order of magnitude. Categories whose products sit on the network edge (Firewall/VPN, ZTNA, IAM gateways) get exploited far more often than categories whose products run on hardened endpoints or inside the security stack (EDR, SIEM, vuln management).
Inside Track A, the per-vendor exploitation rate further sharpens the point. The pure-play vendors with the highest KEV-hit-per-CVE ratios in the window:
| Vendor | Category | CVEs (24mo) | KEV adds | KEV % |
|---|---|---|---|---|
| Sonicwall | Firewall / VPN / NGFW | 31 | 3 | 9.68% |
| Ivanti | Firewall / VPN / NGFW | 121 | 11 | 9.09% |
| Cisco | Firewall / VPN / NGFW | 211 | 14 | 6.64% |
| Fortinet | Firewall / VPN / NGFW | 312 | 10 | 3.21% |
| Broadcom | EDR / AV / Endpoint Protection | 58 | 1 | 1.72% |
| Trendmicro | EDR / AV / Endpoint Protection | 60 | 1 | 1.67% |
| F5 | Firewall / VPN / NGFW | 92 | 1 | 1.09% |
| Juniper | Firewall / VPN / NGFW | 136 | 1 | 0.74% |
| Elastic | SIEM / SOAR / Log Mgmt | 65 | 0 | 0.0% |
| Splunk | SIEM / SOAR / Log Mgmt | 51 | 0 | 0.0% |
Common weaknesses
The Track A weakness profile is dominated by classic management-plane bugs. Top of the list: CWE-79 (10.8%), CWE-78 (5.9%), CWE-22 (4.0%), CWE-89 (3.5%), CWE-787 (3.2%). These are the injection, authorization, and traversal classes that have plagued web-management interfaces for two decades. Memory-safety bugs (CWE-416, CWE-787) are present but not dominant.
Track B looks different. Microsoft Defender, Apple XProtect, and AWS-side security agents skew memory-safety: CWE-416 use-after-free and CWE-787 out-of-bounds write top the list. These are products built in large C/C++ codebases inside generalist OS or cloud platforms; the weakness profile mirrors the host platform's profile, not security software's.
Pure-play vs generalist: the parallel-track comparison
The two tracks differ in three structural ways:
- Codebase age and language. Track A is a mix of C/C++ network stacks, PHP/Perl management UIs, and recent Go services. Track B is dominated by mature C/C++ inside Windows or macOS or large AWS service codebases. The weakness profile follows the language.
- Internal fuzz / red-team maturity. Microsoft, Apple and Google have multi-decade internal security programs; their security sub-products inherit that maturity. The pure-play vendors vary widely; the gap between, e.g., Cloudflare's product security and Citrix's product security is large.
- Disclosure cadence. Pure-play vendors publish when CVEs are ready; generalist vendors batch them into Patch Tuesday or quarterly CPUs. This shapes the monthly time series but doesn't change the annual totals.
Acquisitions: a question we cannot yet answer well
One of the questions a security-software analysis ought to ask: does a vendor acquisition trigger a measurable change in CVE publication rate? Two hypotheses come up in the wild:
- H1: Acquisitions trigger a one-time burst of CVEs from due-diligence security review by the acquiring company.
- H2: Long-term vuln publication pace shifts after acquisition — up if the new owner invests, down if they cut.
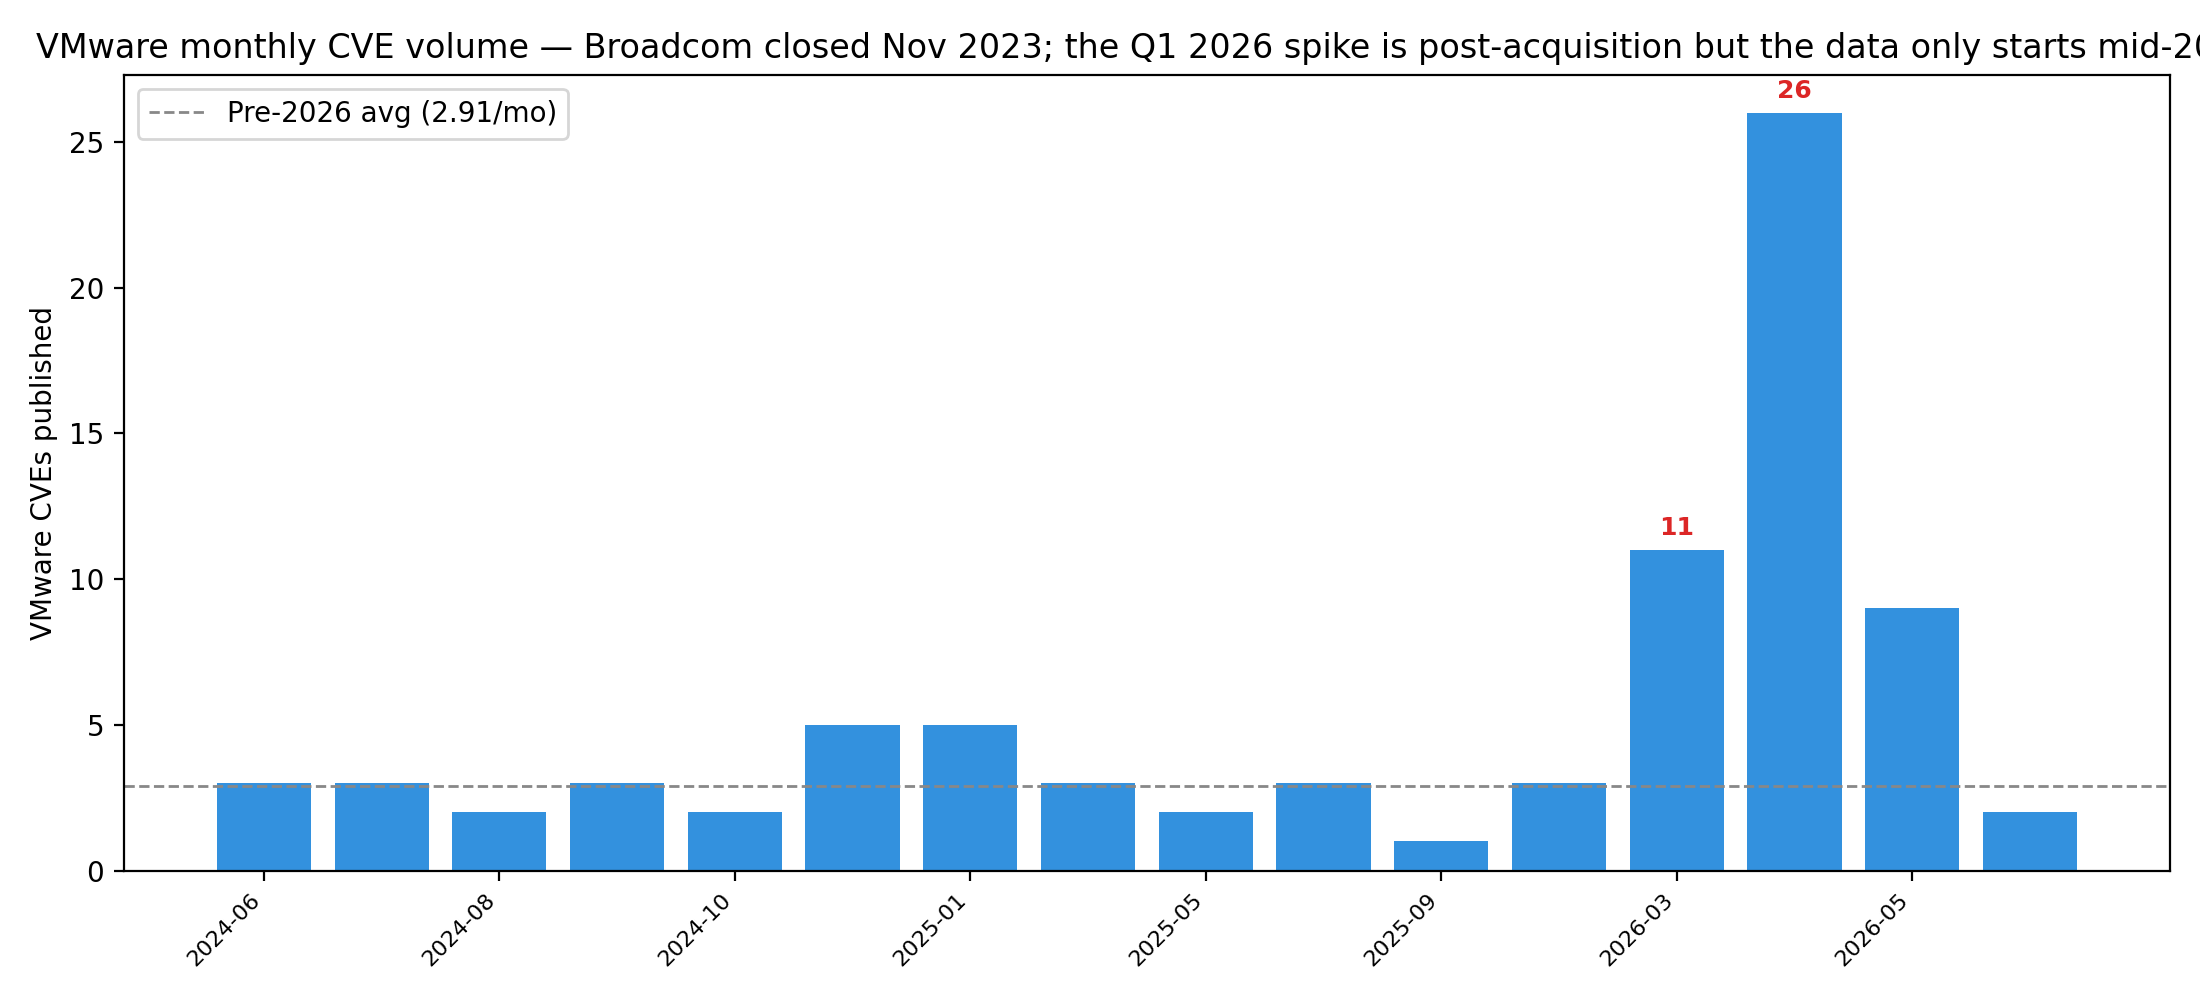
The data does not support a strong claim on either. The 24-month window covers only one major security-vendor deal cleanly — the Broadcom acquisition of VMware (closed November 2023) — and even that case is one-sided: our per-vendor monthly series for VMware starts mid-2024, so we cannot see the pre-deal baseline. What we can see: a Q1 2026 spike of 37 CVEs in two months (March 11 + April 26), against a pre-2026 average of 2.91 CVEs/month. That is roughly a 6.4× surge, large but with no causal evidence behind it.
The deals we'd most want to examine if the data window were wider: Splunk → Cisco (announced March 2024, closed September 2024), Symantec → Broadcom (closed November 2019), Carbon Black → VMware (2019) → Broadcom (2023), FireEye/Mandiant → Google (closed September 2022), and the McAfee Enterprise → Trellix split (2022). All of these either predate the available window or involve CPE-vendor-string discontinuities (Symantec CVEs still publish under the symantec CPE vendor, not broadcom) that would have to be resolved before any pace claim could be made.
Exploitability
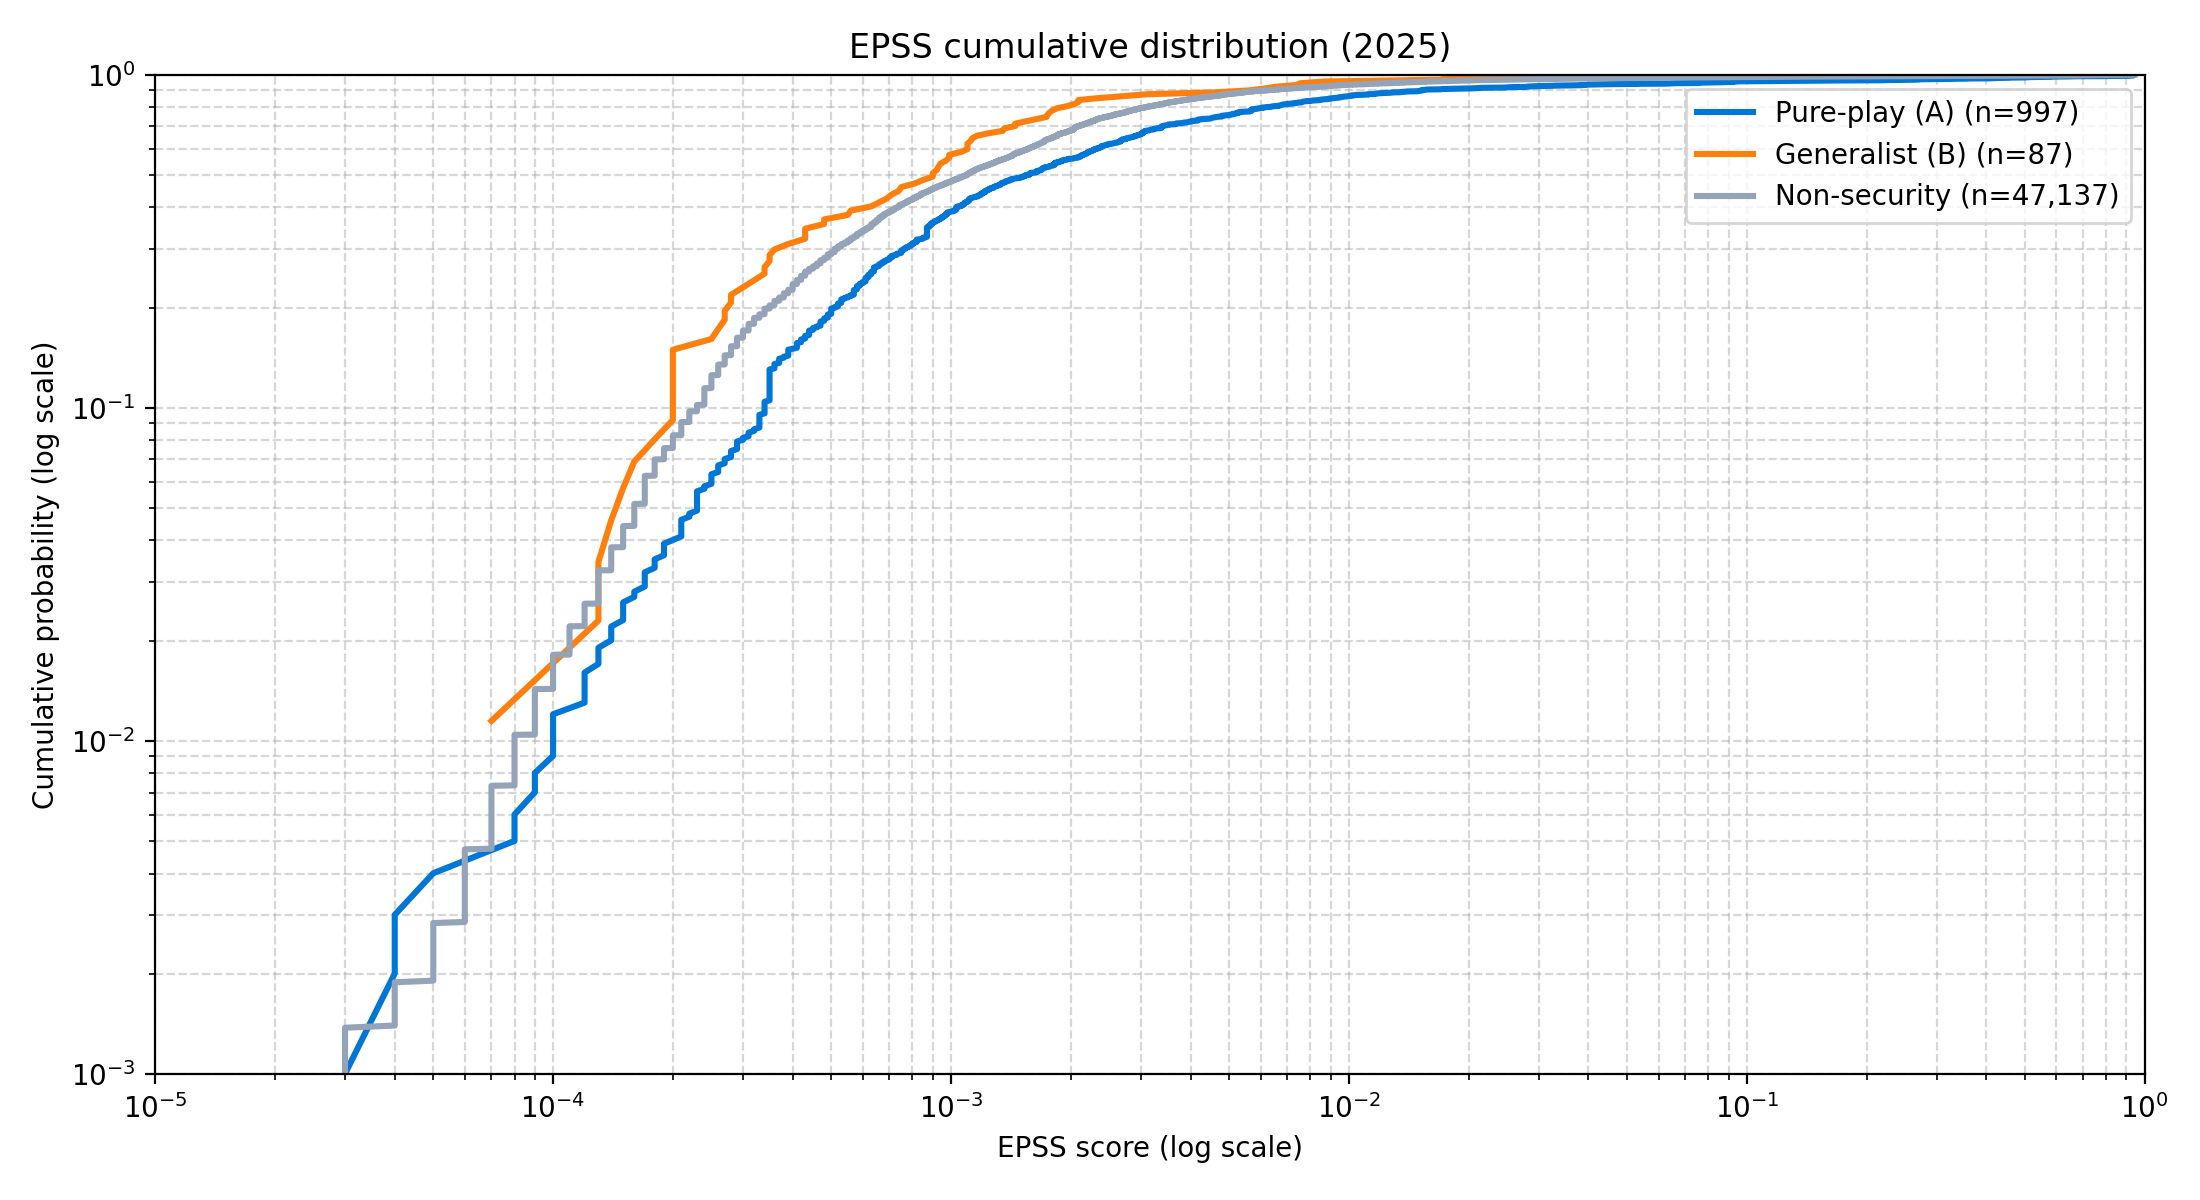
By EPSS, pure-play security software carries materially higher near-term exploitation probability than the non-security baseline. Mean EPSS in Track A is 0.027 (vs. 0.0101 for non-security software), with 4.51% of Track A CVEs scoring above 0.1 vs. 1.6% for the baseline. Track B sits in between at 1.15%.
Note: FIRST.org’s EPSS v4 rollout in September 2025 recalibrated score scales — v4 assigns more conservative initial scores than v3 did — and this comparison spans the transition, so the absolute means should be read as indicative rather than precise.
Combined with the KEV-rate split by category, the operational picture is consistent: the security products attackers actually target are the ones on the network edge, and EPSS picks up on that pattern before CISA does.
About this analysis
Year over year
| Track A (2025) | Track A (2026 to date) | Track B (2025) | Track B (2026 to date) | |
|---|---|---|---|---|
| CVEs published | 997 | 364 | 87 | 40 |
| Average CVSS base score | 6.65 | 6.75 | 6.18 | 6.84 |
| High or Critical | 45.1% | 44.2% | 31.0% | 47.5% |
| KEV total | 37 | 19 | 0 | 2 |
Recommendations
For security-software producers
Three priorities, in order of leverage. First, treat the management plane as the primary attack surface. The data is unambiguous: injection, authorization-bypass and path-traversal bugs in management interfaces dominate the Track A weakness profile, and categories whose products sit on the network edge dominate the KEV rate. Network-edge products should ship with the management interface disabled from public networks by default, and the vendor should be vocal about that posture.
Second, dogfood your own product against an internal red team with renewed mandate quarterly. The gap in product security maturity between, e.g., Cloudflare and Citrix is not a mystery — the maturity differential mostly reflects the maturity of the internal security programme, not the technology.
Third, fuzz-and-publish on a public cadence. Track B vendors (Microsoft, Apple, Google) publish detailed acknowledgement of internal-found vs. external-reported bugs every cycle. Pure-play vendors mostly don't. The same cadence at smaller scale is achievable and is the single best signal the field has of product-security maturity.
For enterprises consuming security software
Inventory the security software in your stack the way you would any other supply-chain risk. Rank vendors by KEV-hit-per-CVE, not by CVE volume. A vendor that publishes 30 CVEs of which 4 land on KEV (Citrix-like) is in operational terms a higher risk than a vendor that publishes 9,000 CVEs of which 11 land on KEV (Linux-like). Demand SBOMs and fuzz-coverage commitments from your network-edge vendors specifically; their bugs reach you fastest.
Author:
Arve Kjoelen (Barracuda Networks). Data: NVD, EPSS, CISA KEV. Snapshot
09 Jun 2026 04:44 UTC. Pure-play / generalist taxonomy is curated and
editable; the source-of-truth lives at
security-vulns/_security_vendors.py. Feel free to share,
adapt, or build on this work; attribution appreciated.